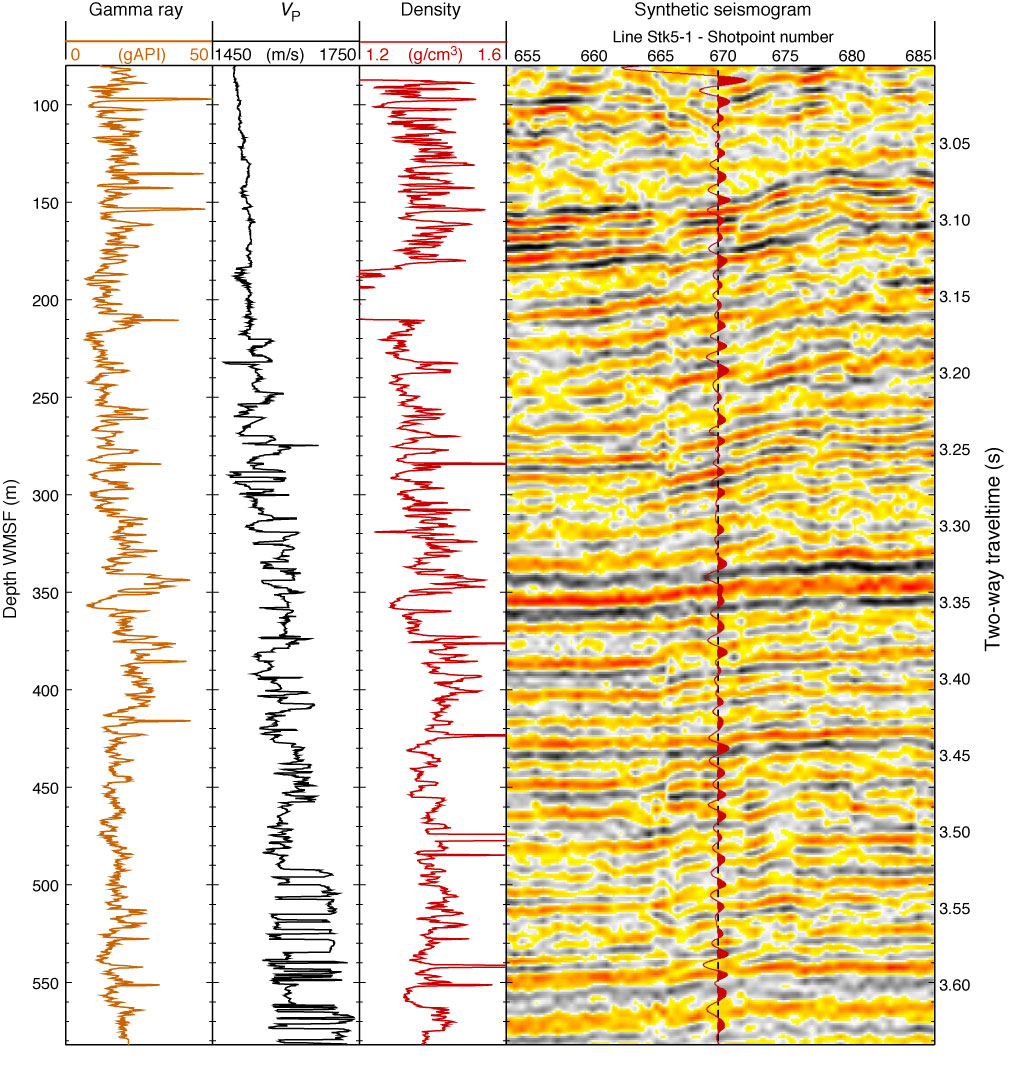
Figure F40. Comparison of synthetic seismogram calculated from density and VP logs in Hole U1341B and multichannel seismic (MCS) Line Stk5-1 (Sakamoto et al., 2005) near Site U1341. The gamma ray log is shown as a reference to the other logs and the logging units. A constant density value was used between 180 and 210 mbsf to correct for poor data quality. gAPI = American Petroleum Institute gamma ray units.

Previous | Close | Next | Top of page