Previous | Close | Next
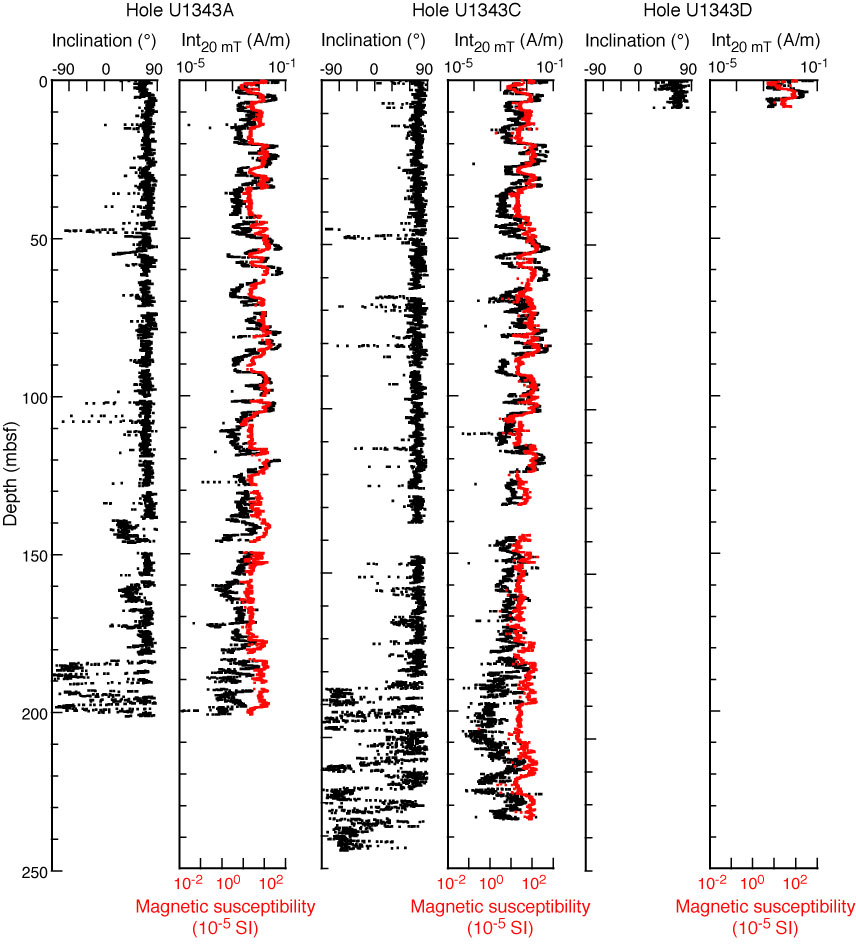
Figure F16. Inclination and intensity of remanent magnetization after 20 mT AF demagnetization (Int20 mT), Holes U1343A, U1343C, and U1343D. Intensity data are plotted with STMSL magnetic susceptibility data.
Previous | Close | Next | Top of page