Previous | Close | Next
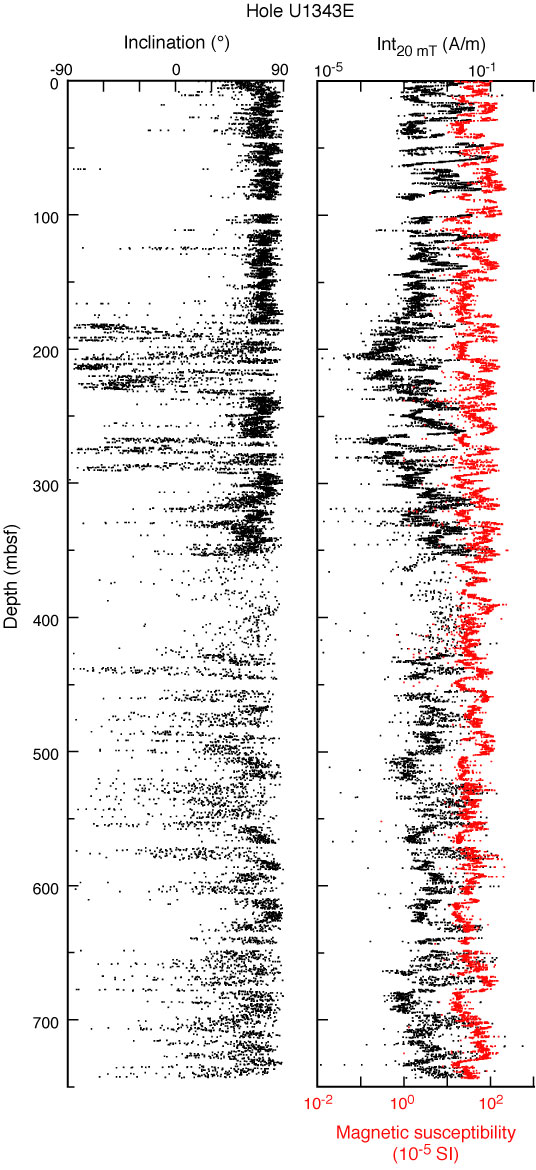
Figure F17. Inclination and intensity of remanent magnetization after 20 mT AF demagnetization (Int20 mT), Hole U1343E. Intensity data are plotted with STMSL magnetic susceptibility data.
Previous | Close | Next | Top of page