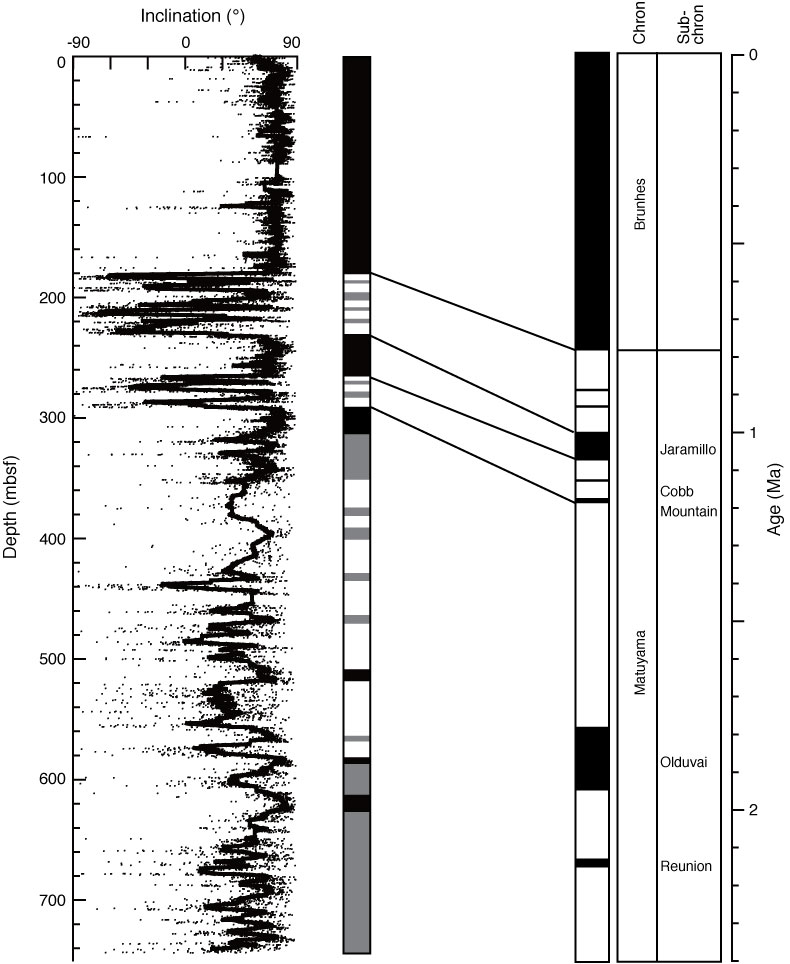
Figure F18. Inclination data (dots) and 60 point (corresponding to ~0.5 m) averaged inclination values (solid line), Hole U1343E. Tentative polarity zonation (black = normal polarity, white = reversed polarity, and gray = uncertain polarity) and presumable correlation with the polarity chrons are also shown.
Previous | Close | Next | Top of page