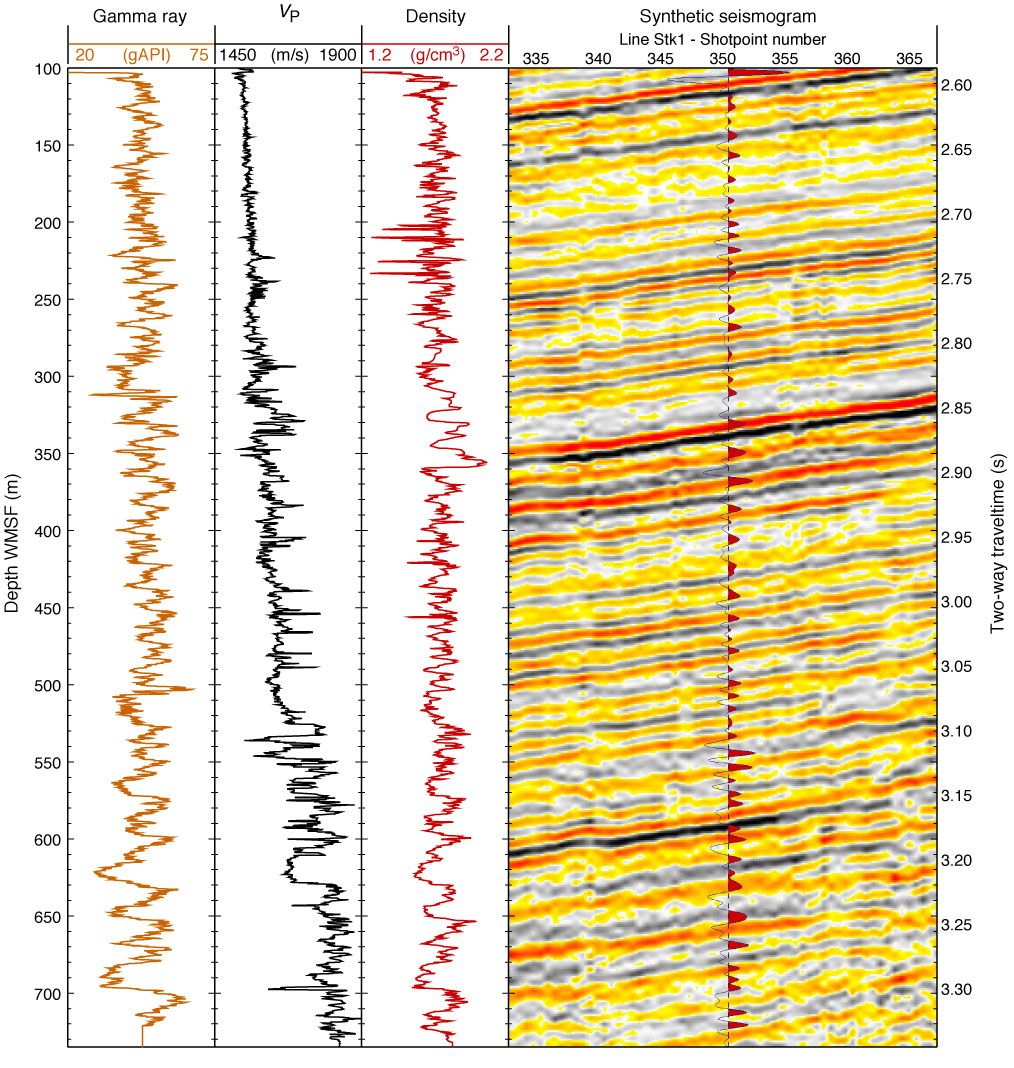
Figure F42. Comparison of the synthetic seismogram calculated from density and VP logs in Hole U1343E and MCS Line Stk1 (Sakamoto et al., 2005) across Site U1343. The gamma ray log is shown as a reference to the other logs and logging units. The density used is a composite of the density log and GRA data from 307 to 360 m WMSF. gAPI = American Petroleum Institute gamma ray units.
Previous | Close | Next | Top of page