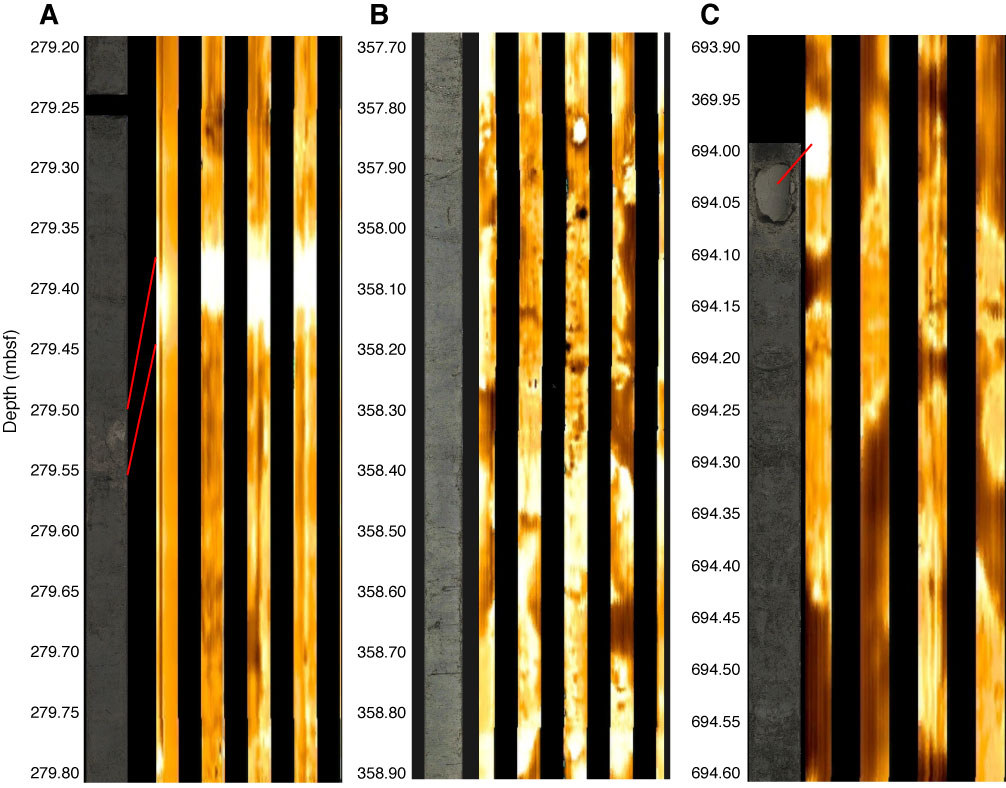
Figure F43. Correlation between Formation MicroScanner (FMS) electrical images and core observations in each of the three logging units. A. Ash layer in logging Unit 1, Section 323-U1343E-33H-3 (279.2–279.8 m WMSF). B. High-density interval in logging Unit 2, Section 323-U1343E-41H-6 (357.358.9 m WMSF). C. Dolostone in logging Unit 3, Section 323-U1343E-78X-6 (693.9–694.6 m WMSF). The depths of the core images have been adjusted by 5 m to correct for the difference between the seafloor depth identified by the drillers and by the gamma ray log. The contrast in the core images is enhanced.
Previous | Close | Next | Top of page