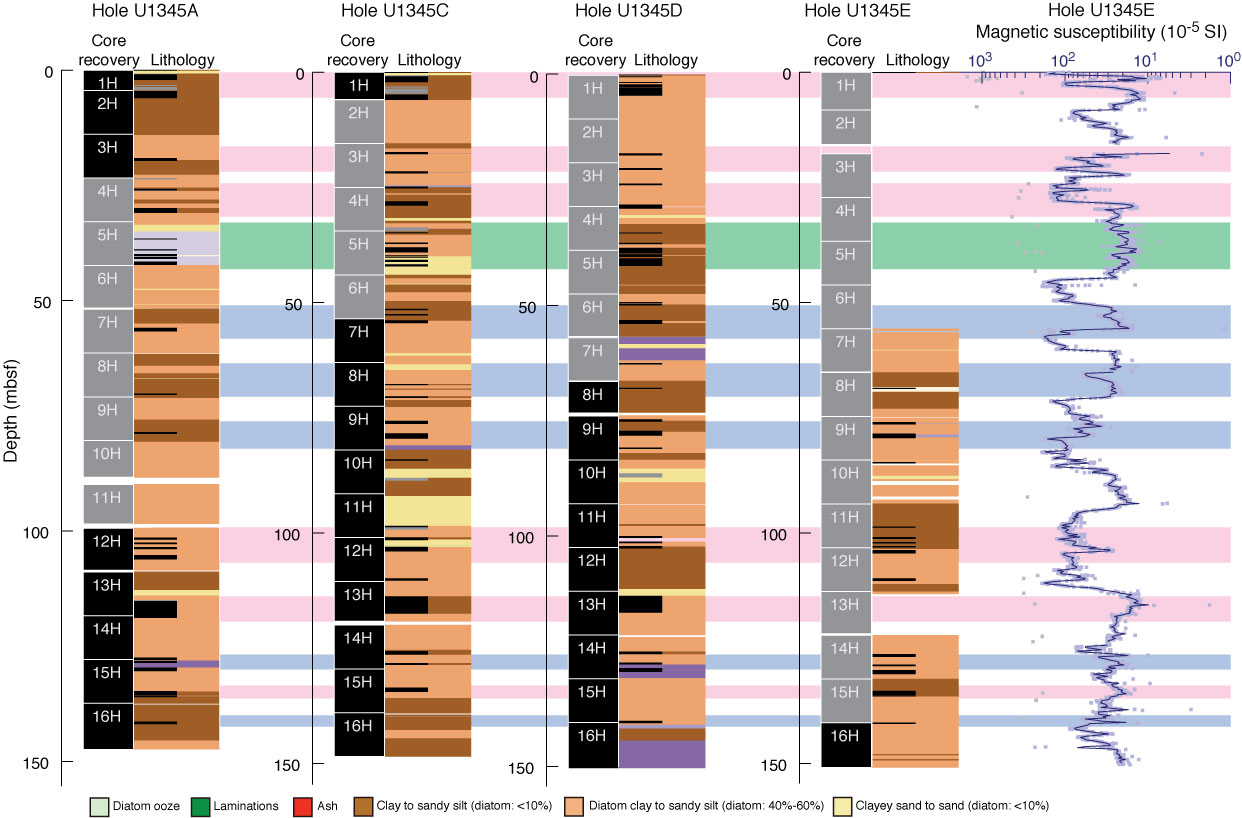
Figure F11. Correlation of laminated intervals in Holes U1345A, U1345C, U1345D, and U1345E, plotted with magnetic susceptibility. Pink bars = biogenic-rich laminations, blue bars = siliciclastic-rich laminations, green bars = laminations with authigenic carbonates.

Previous | Close | Next | Top of page