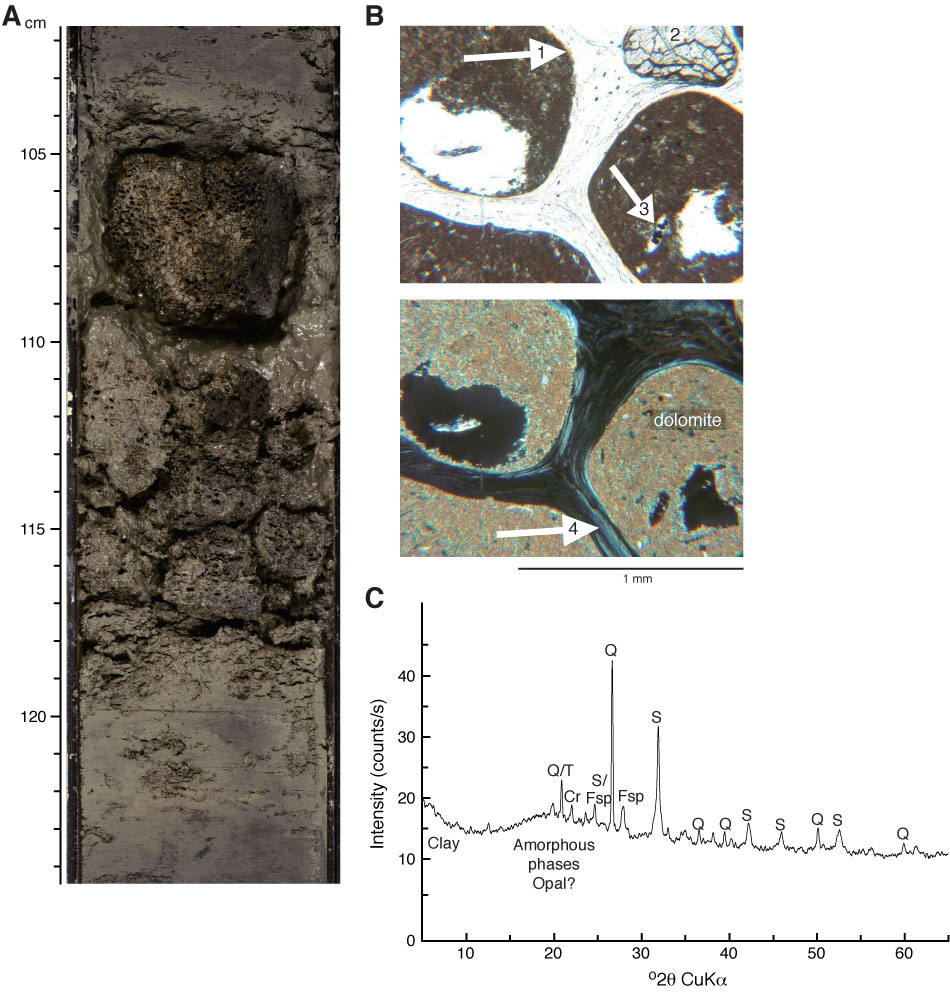
Figure F12. Tube worm colony mold. A. Image of colony in place in the core (interval 323-U1345C-16H-3, 102–124 cm). B. Photomicrographs of the colony in thin section under plane-polarized light (above) and cross-polarized light (below). Numbers and arrows indicate areas where (1) dolomitization impinges on the tube walls, (2) minerals occur at the intersection of tube walls, (3) diatoms are visible as part of the diatom clayey silt sediment infill, and (4) birefringence occurs parallel to the tube walls. C. X-ray diffractogram showing mineral composition of the colony after digesting carbonates with 10% HCl (Sample 323-U1345C-16H-3, 108–110 cm). Q = quartz, T = tridymite, Cr = cristobalite, S = siderite, Fsp = feldspar. Note that peaks are shifted 0.3° too high, so there may be Ca or Mg replacement of Fe.
Previous | Close | Next | Top of page