Previous | Close | Next
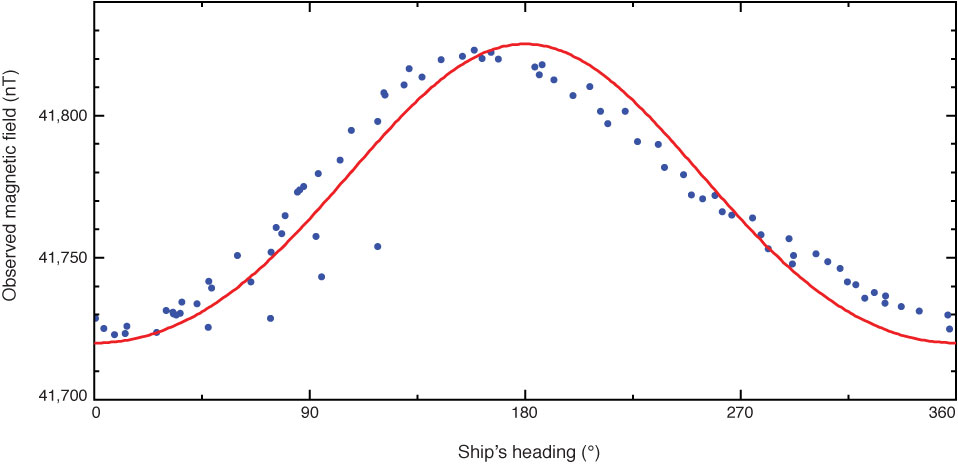
Figure F4. Plot of variation of measured field with ship's heading. Solid red line is computed best fit curve to the measured magnetic field (blue circles) using the formula of Bullard and Mason (1961).
Previous | Close | Next | Top of page