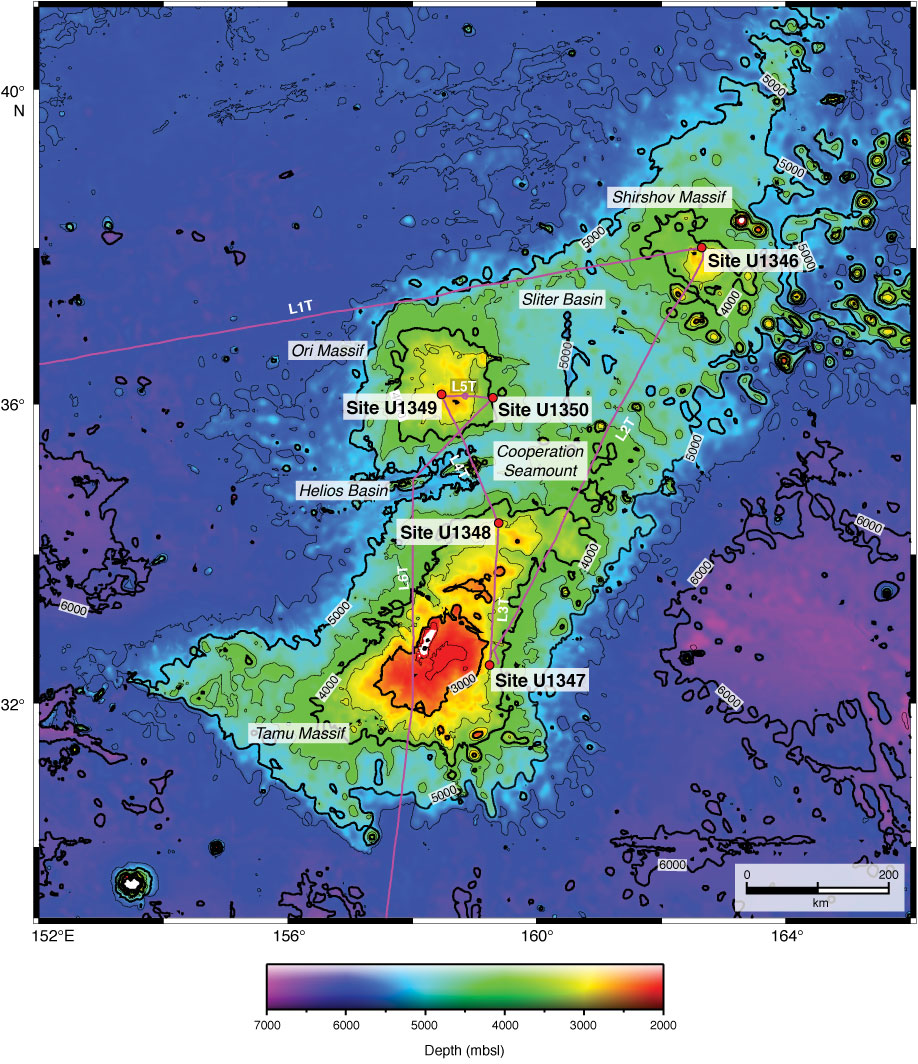
Figure F6. Bathymetric map of the Shatsky Rise using the 30 arc-s resolution GEBCO_08 grid (General Bathymetric Chart of the Oceans, 2008). Solid lines = ship tracks during transits, red circles Expedition 324 drill sites. L1T = Transit EXP324-L1T (Fig. F7), L2T = Transit EXP324-L2T (Fig. F8), L3T = Transit EXP324-L3T (Fig. F9), L4T = Transit EXP324-L4T (Fig. F10), L5T = Transit EXP324-L5T (Fig. F11), L6T = Transit EXP324-L6T (Fig. F12).
Previous | Close | Next | Top of page