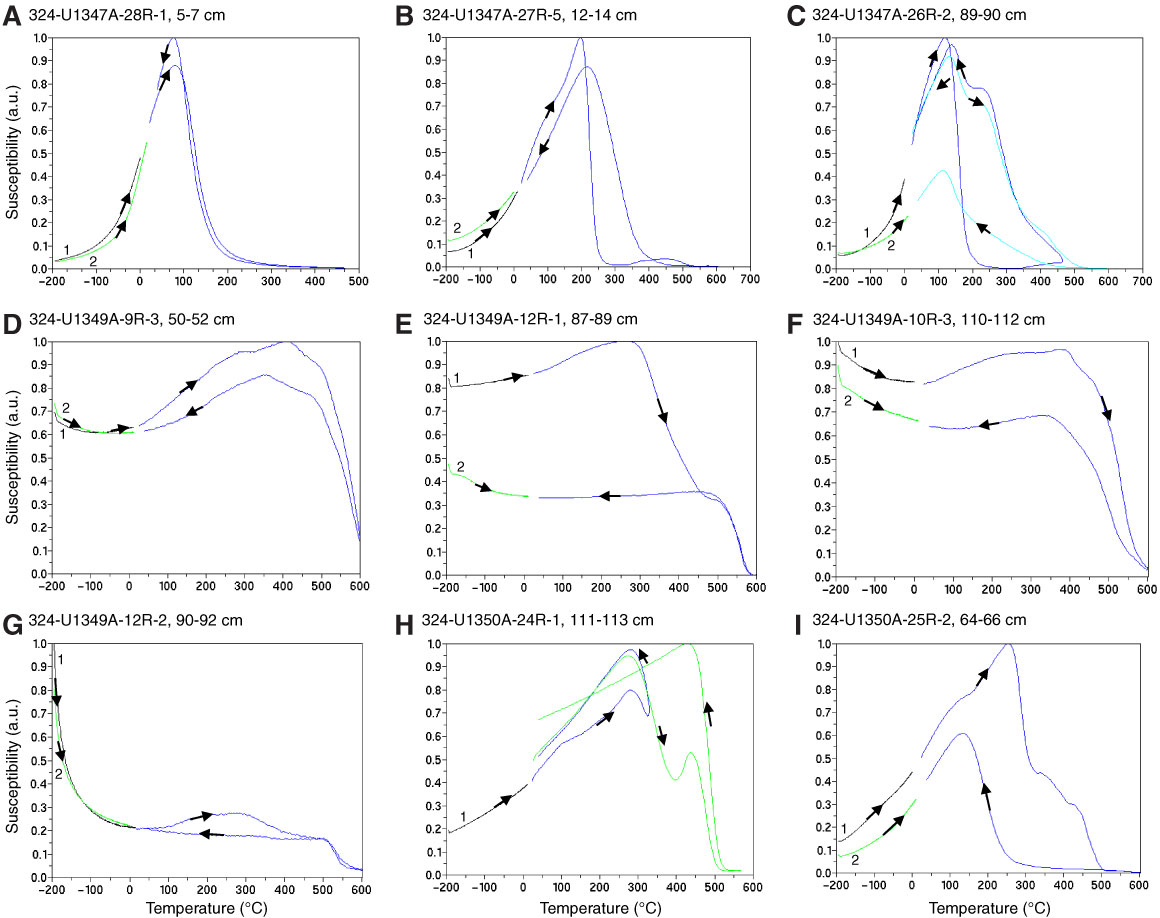
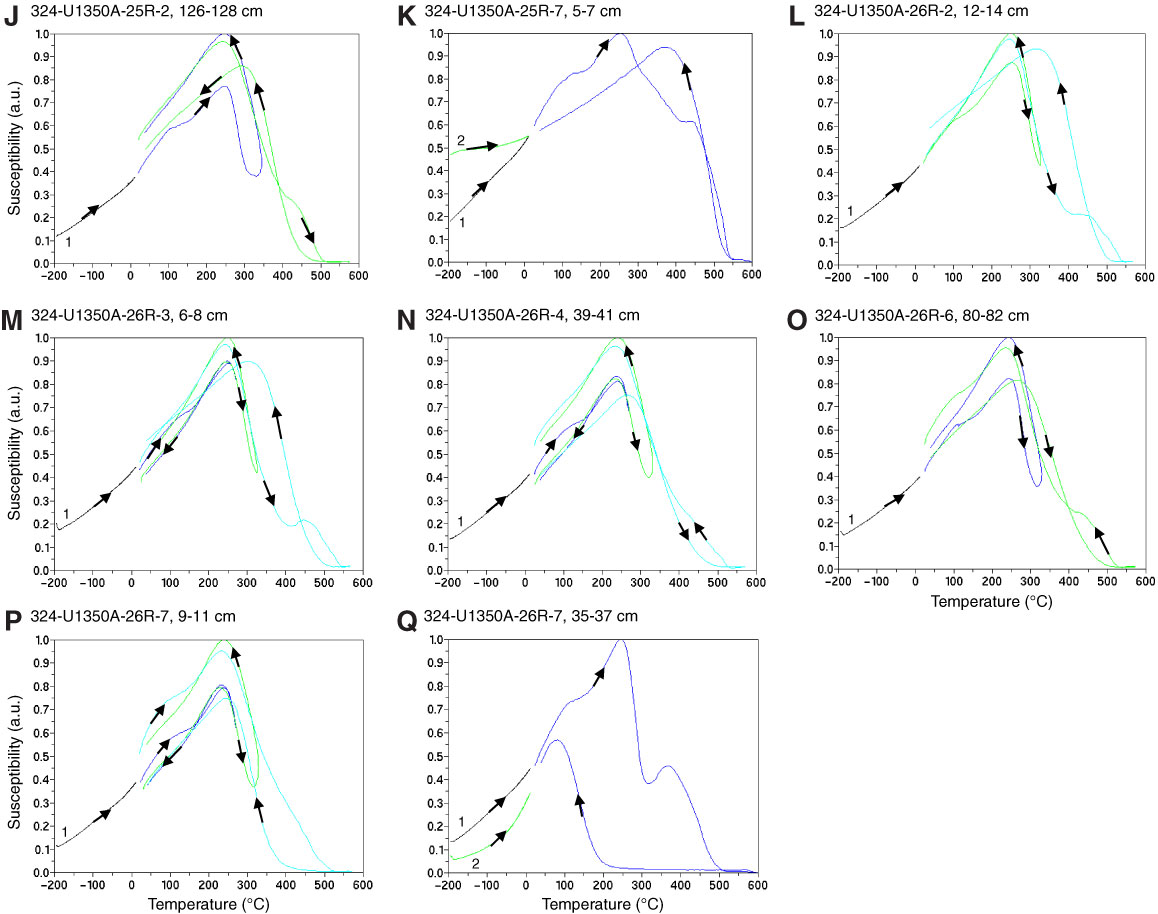
Figure F6. A–Q. Plots of low-field susceptibility vs. temperature curves. Heating and cooling curves are indicated with arrows. The curves labeled “1” are before heating–cooling cycle, and the curves labeled “2” are after heating–cooling cycle.
Previous | Close | Next | Top of page