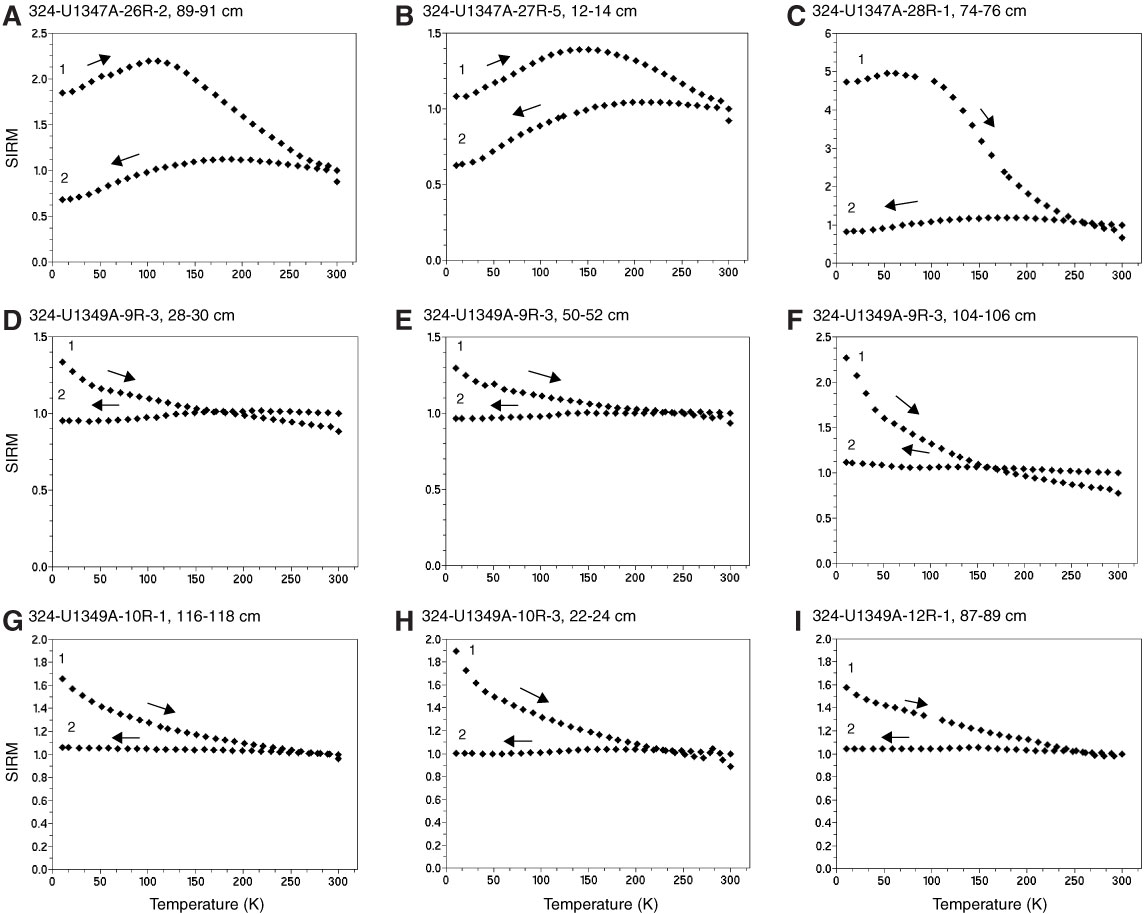
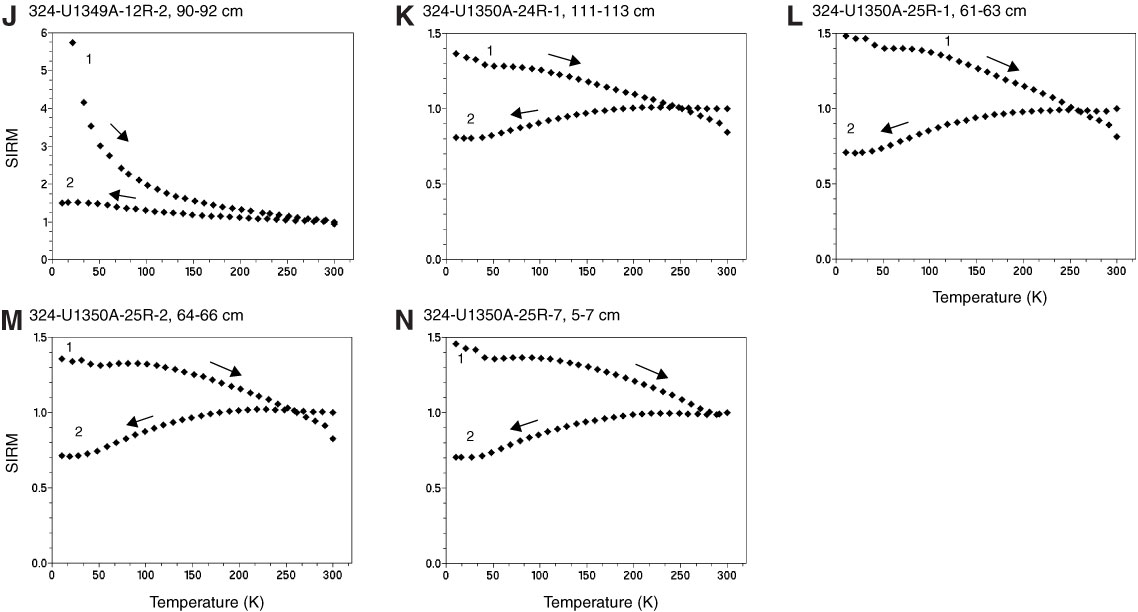
Figure F7. A–N. Plots of temperature dependence of saturation remanence (SIRM) produced by a 2.5 T field. The curves labeled “1” show the zero-field warming curve from 20 to 300 K, and the curves labeled “2” show the zero-field cooling (from 300 to 20 K) curve for SIRM produced at 300 K.
Previous | Close | Top of page