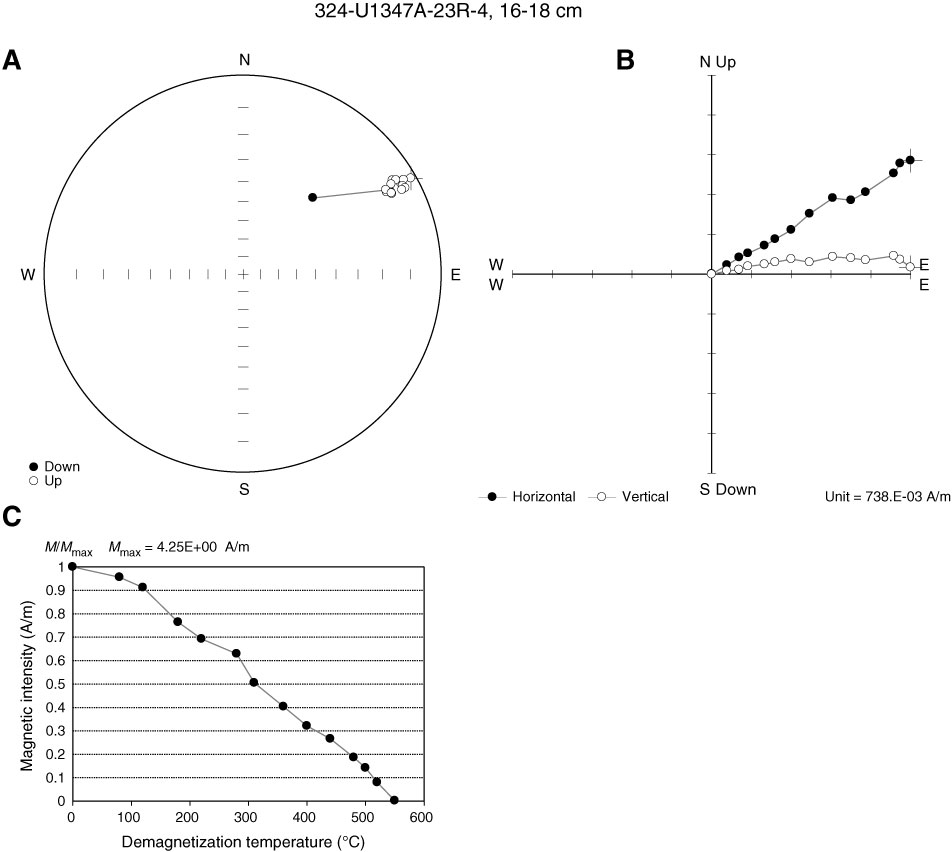
Figure F15. Thermal demagnetization results (Sample 324-U1347A-23R-4, 16–18 cm). A. Equal angle spherical projection. B. Zijderveld plot. C. Magnetic intensity vs. demagnetization temperature. This sample shows linear decay of magnetization intensity with increased temperature.
Previous | Close | Next | Top of page