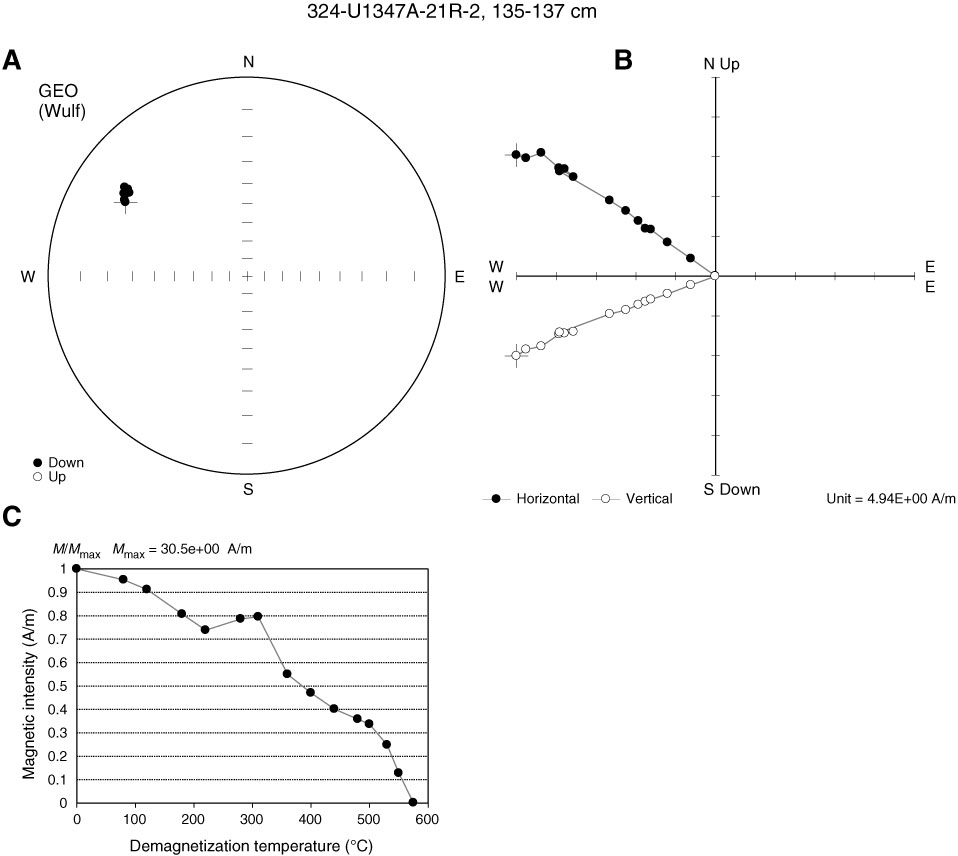
Figure F16. Thermal demagnetization results (Sample 324-U1347A-21R-2, 135–137 cm). A. Equal angle spherical projection. B. Zijderveld plot. C. Magnetic intensity vs. demagnetization step. This sample displays a small self-reversal during thermal demagnetization at moderate temperature steps.
Previous | Close | Next | Top of page