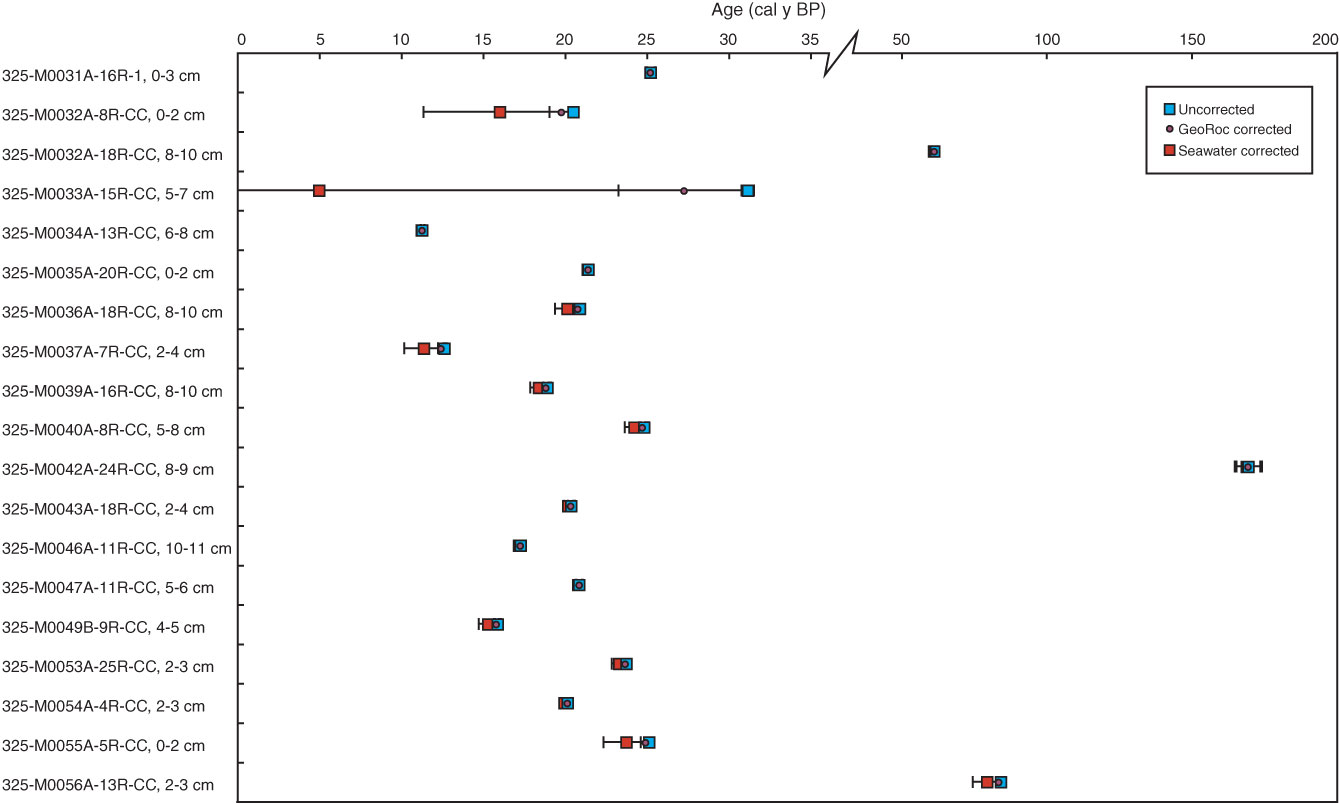
Figure F11. The effect of initial 230Th correction for Expedition 325 U-Th dated samples. Uncorrected ages (blue squares) and ages corrected for crustal (GeoRoc) contamination (purple circles) and seawater Th incorporation (red squares) are shown. Note the break and change in scale for the age axis. cal y BP = calibrated years before present (years before 1950 AD).
Previous | Close | Next | Top of page