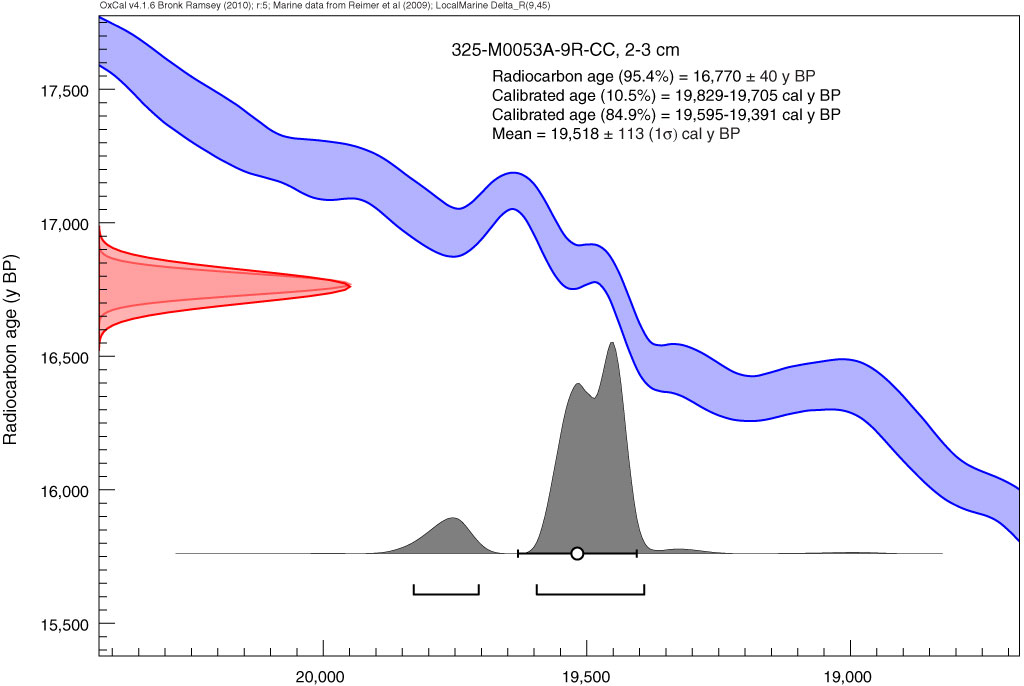
Figure F12. Illustration of the effect of radiocarbon calibration on the distribution of uncertainty in the calibrated ages of Expedition 325 corals. The uncalibrated radiocarbon age and uncertainty are shown as the red normal distribution, and the marine09 calibration curve representing the apparent radiocarbon age variability caused by changes in the marine Δ14C through time is shown in blue. The resultant calibrated age distribution is shown in gray, with the 95.4% and 68% probability bounds shown as bars below. For the purposes of comparing ages among corals, the mean calibrated age (white circle) is shown. It should be noted that in the summary plots where age interpretations are rounded to 1 k.y., this sample will be shown as 20 calibrated years before present (cal y BP; years before 1950 AD), whereas the calibrated age lies in the range 19.39–19.83 cal y BP. (See Bronk Ramsey [2009], as well as Bronk Ramsey [2010] at c14.arch.ox.ac.uk/oxcal.html.)
Previous | Close | Next | Top of page