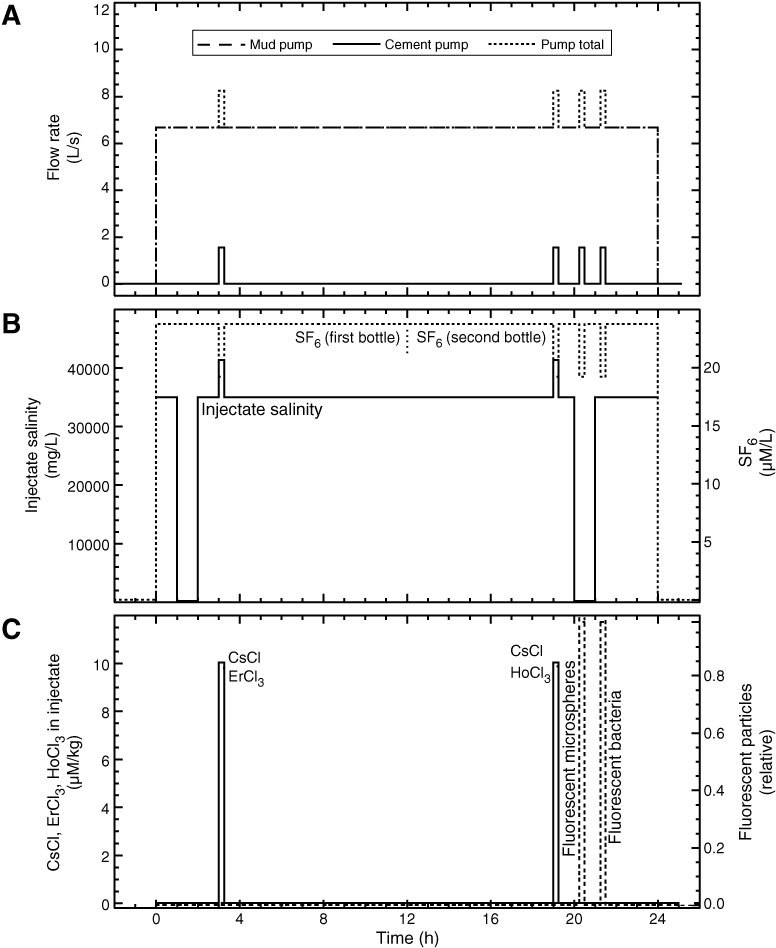
Figure F12. Plots showing schematic variations in pumping rates and tracer concentrations during 24 h pumping experiment. Actual values will be calculated postcruise using detailed records of pumping rates, gas and fluid pressure, and injectate chemistry. A. Flow rate. The mud pump was run at a constant rate of 20 strokes per minute (~7 L/s). The cement pump added injectate four times during the experiment, briefly increasing total injection rate into the formation. B. Injectate salinity and SF6 concentration. SF6 was added to the injectate using a regulator and valve manifold connected to the standpipe upstream of the mud pump. A differential pressure of ~80 psi was used to inject the gas at a constant concentration, except when flow from the cement pump was added, briefly reducing the SF6 concentration (but having no influence on the mass rate of SF6 injection). Seawater was the primary injectate, except for two 1 h periods when freshwater was injected and two other times when Cs, Er, and Ho salts were added, temporarily increasing injectate salinity. C. Approximate concentrations of Cs, Er, and Ho salts and relative concentrations of fluorescent microspheres and bacteria.
Previous | Close | Next | Top of page