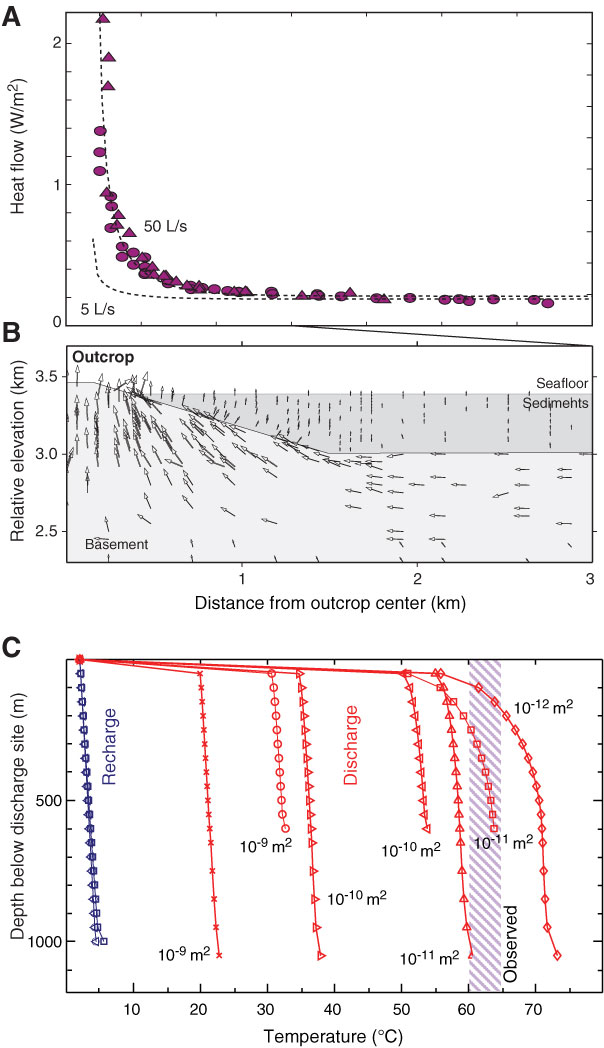
Figure F4. Seafloor heat flow data and numerical modeling results of single-outcrop and outcrop-to-outcrop hydrothermal circulation (modified from Hutnak et al., 2006). A. Heat flow measured within 7 km of Baby Bare outcrop, projected along a single profile. B. Fluid flow vectors through upper basement and across seafloor, simulating single-outcrop circulation. Radial fluid flow results in heat flow pattern shown in A (dashed lines). C. Vertical temperature profiles from two-dimensional simulations of self-sustaining fluid and heat flow from Grizzly Bare to Baby Bare outcrops. Low temperatures are maintained in the recharge conduit (through Grizzly Bare; blue lines and symbols), whereas various temperatures are maintained through the discharge conduit (through Baby Bare; red lines and symbols), with the upflow temperature being dependent on the permeability of upper basement. When permeability is too high, basement is cooled by rapidly flowing fluids. When permeability is too low, basement becomes warmer. A match to the observed regional upper basement temperature of 60°–65°C is achieved with a basement permeability of ~10–11 m2.
Previous | Close | Next | Top of page