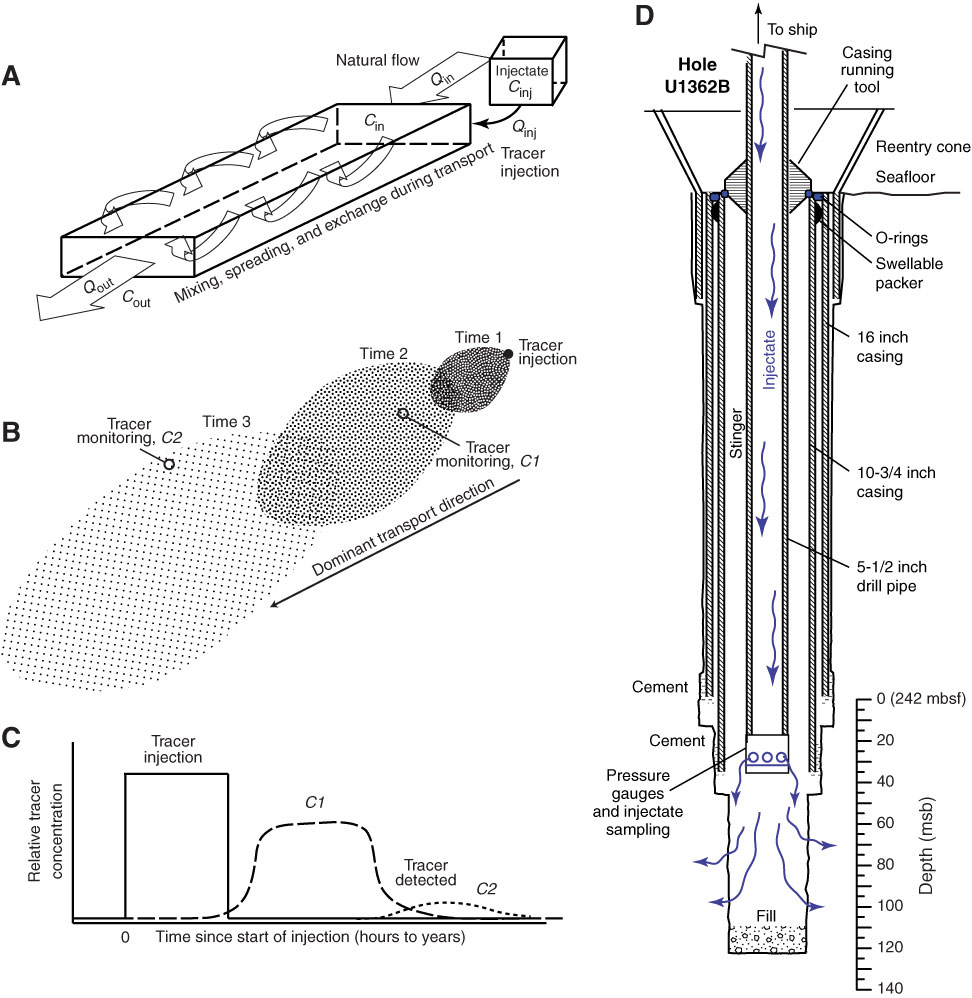
Figure F2. Cartoons illustrating hydrologic tracer concepts and geometry of Expedition 327 borehole injection operations. A. Natural flow system in which water moves laterally through a rock mass at a constant mass rate, Qin = Qout. Injectate is introduced at the upstream end of this system at a constant rate, Qinj, for a finite time. Tracer and natural formation fluid are transported downstream, with tracer mixing, spreading, and exchanging with surrounding formation. B. Tracer is injected for a finite time, leading to formation of a plume. The plume spreads and is transported downstream over time. If tracer is conservative, mass in plume remains constant. C. Schematic chemographs of tracer concentration (breakthrough curves). At the upstream end, the period of constant tracer injection is represented with a square wave (solid line). At one or more downstream (monitoring) locations, the chemograph is attenuated, and the center of mass arrives at a time determined by the mean rate of transport (dashed line). The magnitude of the peak concentration is determined by the rate of dilution with unlabeled formation fluid. Farther downstream, or at a location oblique to the direction of most rapid transport, the chemograph will arrive later and be more strongly attenuated (dotted line). There can also be a chemograph at a single location that has multiple peaks if there are distinct fluid and tracer transport pathways through the formation. D. Schematic illustration of tracer injection geometry in Hole U1362B during Expedition 327. The casing running tool was used to seal the top of the 10¾ inch casing rather than a packer. A piece of pipe at the base of a stinger (drill pipe extending below the casing running tool), contained an injectate fluid sampler and downhole pressure gauges. Additional seals between concentric casing strings ensured that injectate was forced to flow from the stinger into the formation rather than back up to the seafloor.

Previous | Close | Next | Top of page