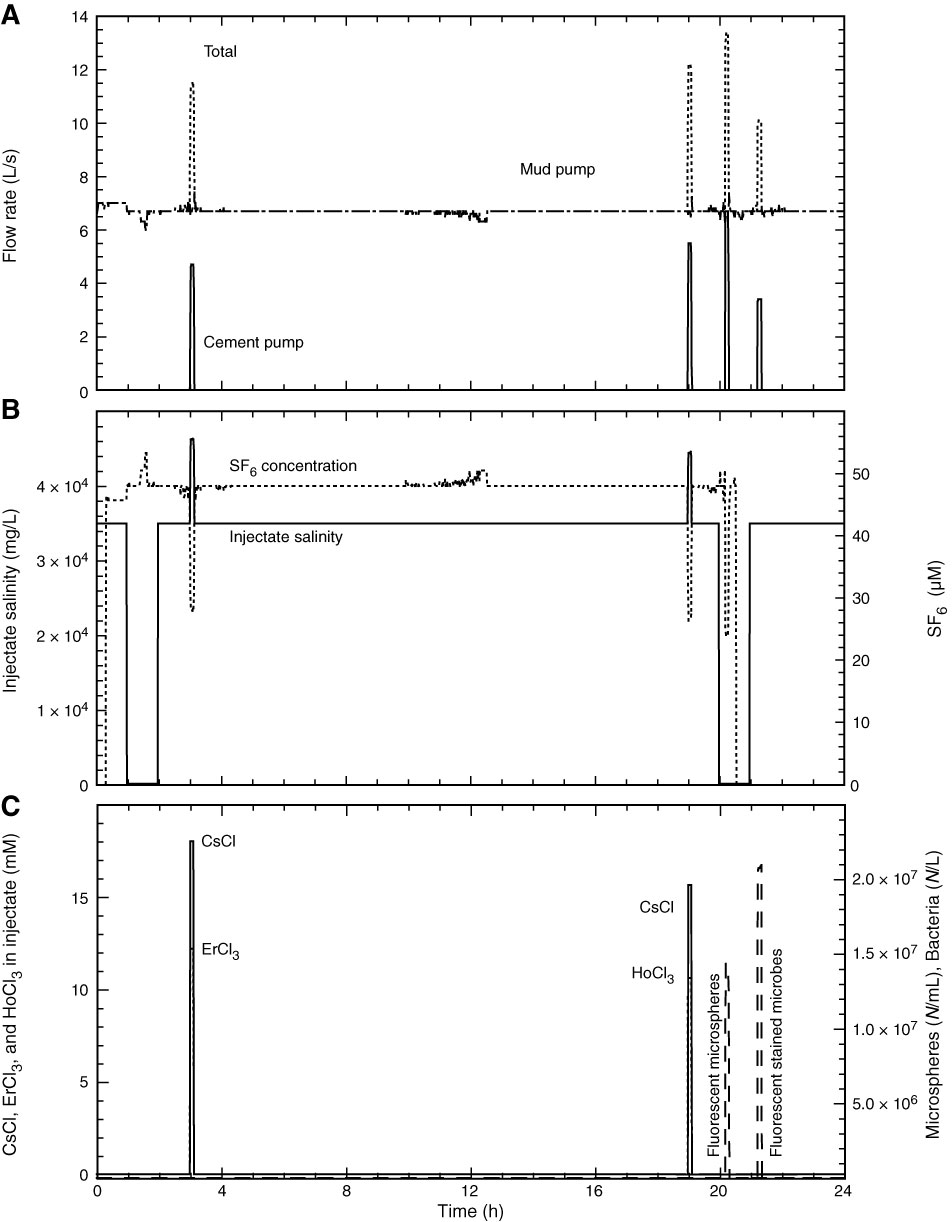
Figure F9. Plots showing variations in pumping rates and tracer concentrations during injection experiment, Expedition 327. Values are based on 1 s pumping records generated by the shipboard RIS, downsampled to 1/min, and measured quantities of tracers injected during known time periods. Actual concentrations and tracer masses injected will be determined based on the composition of injectate samples. A. Flow rate. The mud pump was run at a constant rate of ~6.7 L/s. The cement pump added injectate four times during the experiment, briefly increasing total injection rate into the formation. B. Injectate salinity and SF6 concentration. SF6 was added using a regulator and valve manifold connected to the standpipe upstream of the mud pump. A nearly constant differential pressure was used to inject the gas at a fixed concentration, except when flow from the cement pump was added, briefly reducing the SF6 concentration but having no influence on the mass rate of SF6 injection. Seawater was the primary injectate, except for two 1 h periods when freshwater was injected. At two other times when Cs, Er, and Ho salts were added, injectate salinity increased. C. Concentrations of Cs, Er, and Ho salts and estimates of the concentrations of fluorescent microspheres and stained microbes.
Previous | Close | Next | Top of page