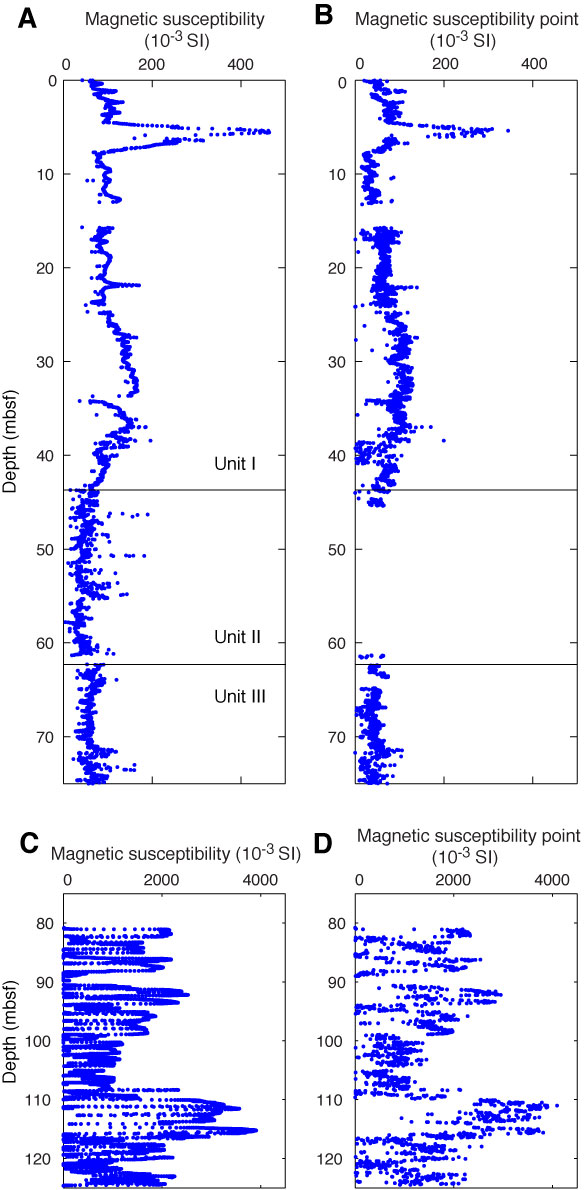
Figure F41. Plots of magnetic susceptibility as a function of depth, Site U1365. A. Measurements made on the Whole-Core Multisensor Logger (WRMSL). B. Point measurements made on the Section Half Multisensor Logger (SHMSL). C. Measurements made on the WRMSL for lithologic Unit IV. D. Point measurements made on the SHMSL for lithologic Unit IV. Note the change in scale between panels showing the sediment units and the basement.
Previous | Close | Next | Top of page