Previous | Close | Next
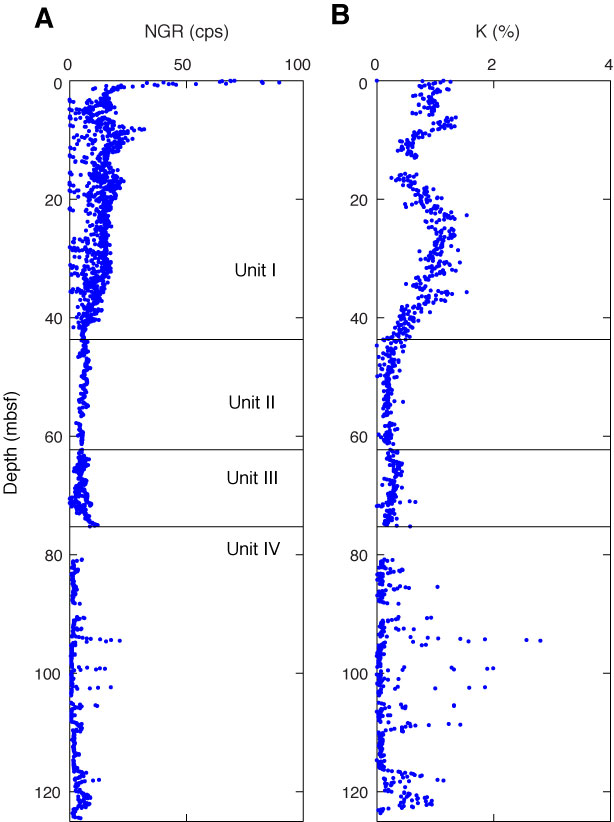
Figure F42. Plots of natural gamma radiation (NGR) as a function of depth, Site U1365. A. Measurements made on whole cores. B. Estimated potassium concentration.
Previous | Close | Next | Top of page