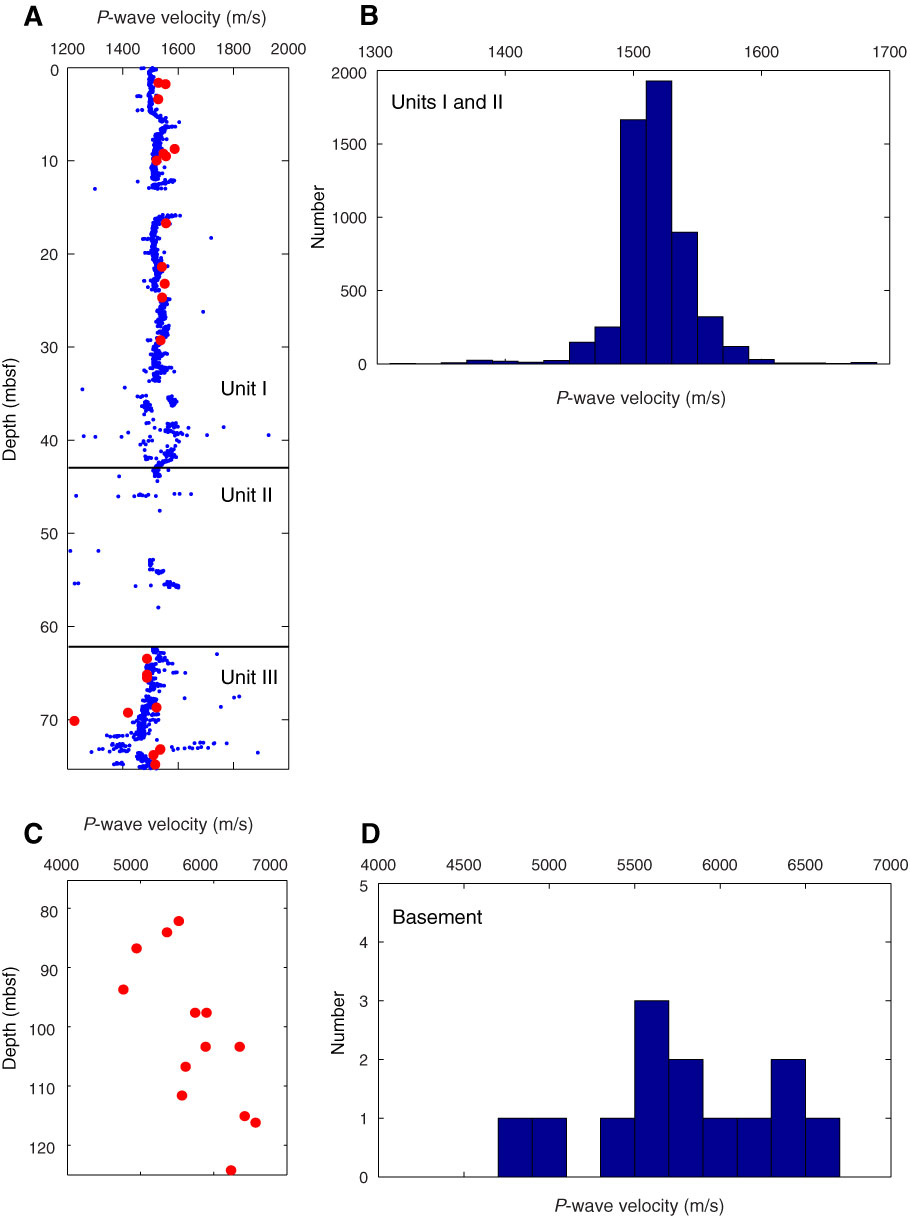
Figure F43. Compressional wave velocity, Site U1365. A. Plot of P-wave velocity measured with the Whole-Round Multisensor Logger (blue circles) and on discrete samples using the Section Half Measurement Gantry (SHMG; red circles). B. Histogram of P-wave measurements for lithologic Units I and III. C. Plot of P-wave velocity measured with the SHMG in basement. D. Histogram of P-wave measurements for lithologic Unit IV.
Previous | Close | Next | Top of page