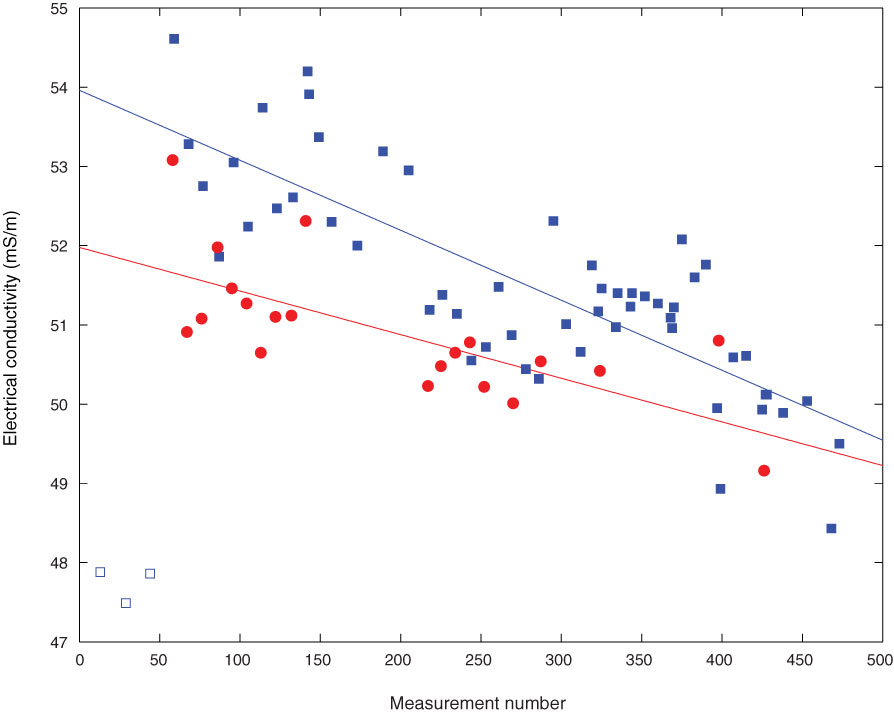
Figure F44. Plot of electrical conductivity measured on International Association for the Physical Sciences of the Oceans standard (red) and on surface seawater (blue). Circles and squares show individual measurements and lines show best linear fit to data.
Previous | Close | Next | Top of page