Previous | Close | Next
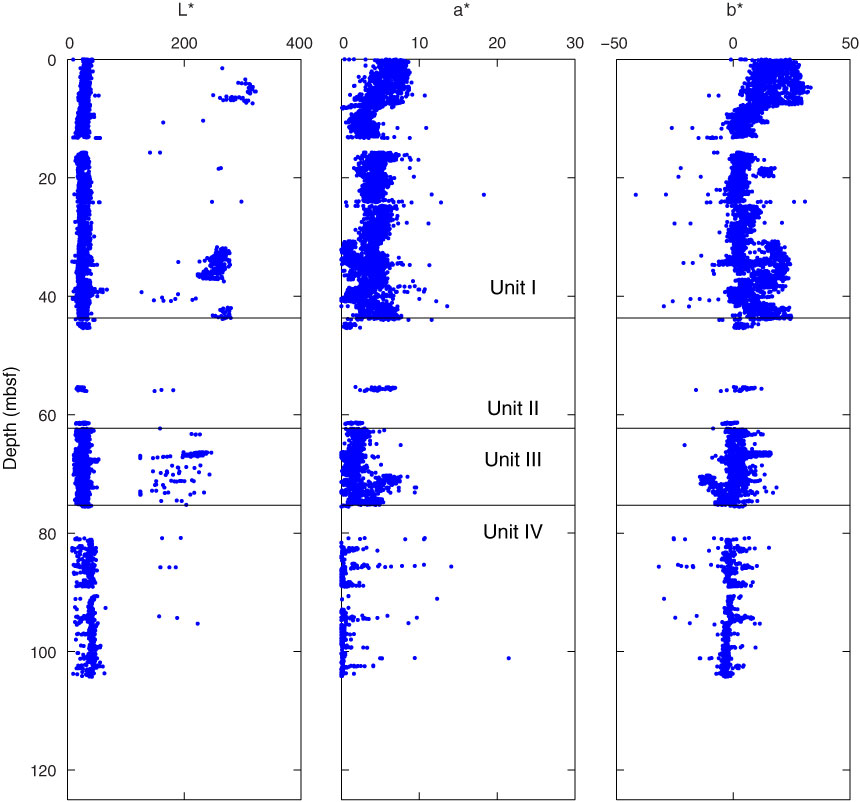
Figure F48. Plots of L*, a*, and b* values with depth, Site U1365.
Previous | Close | Next | Top of page