Previous | Close | Next
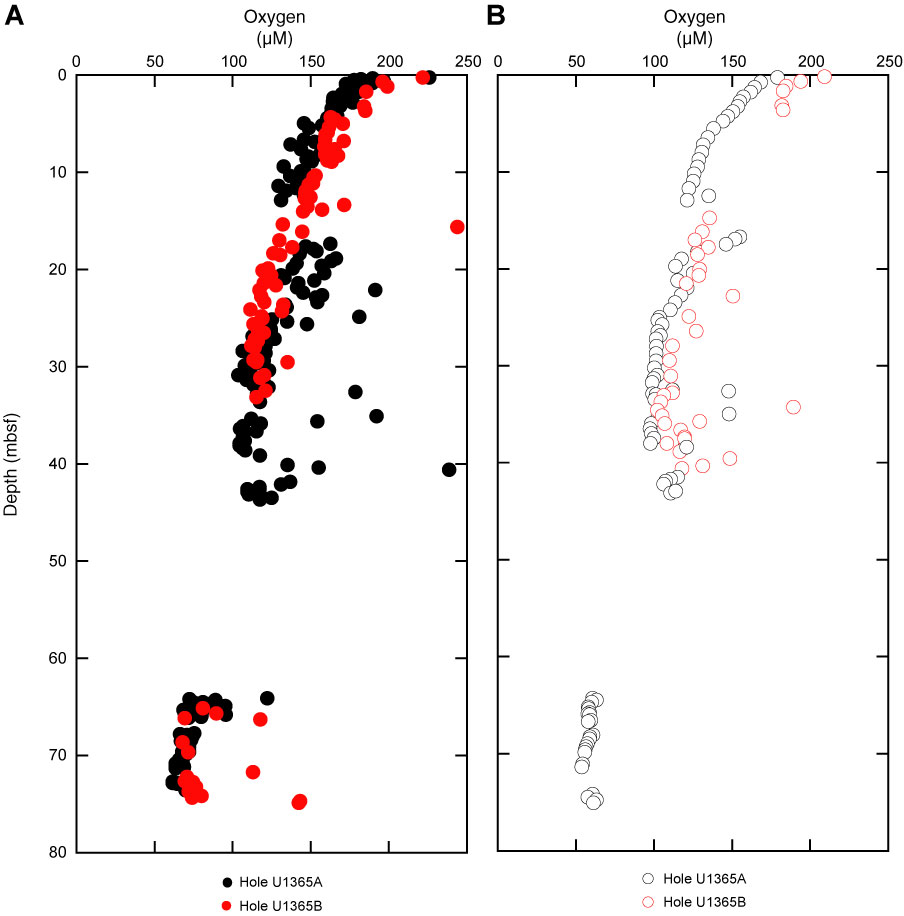
Figure F56. Plots of dissolved oxygen concentrations for Holes U1365A and U1365B measured with (A) electrodes and (B) optodes.
Previous | Close | Next | Top of page