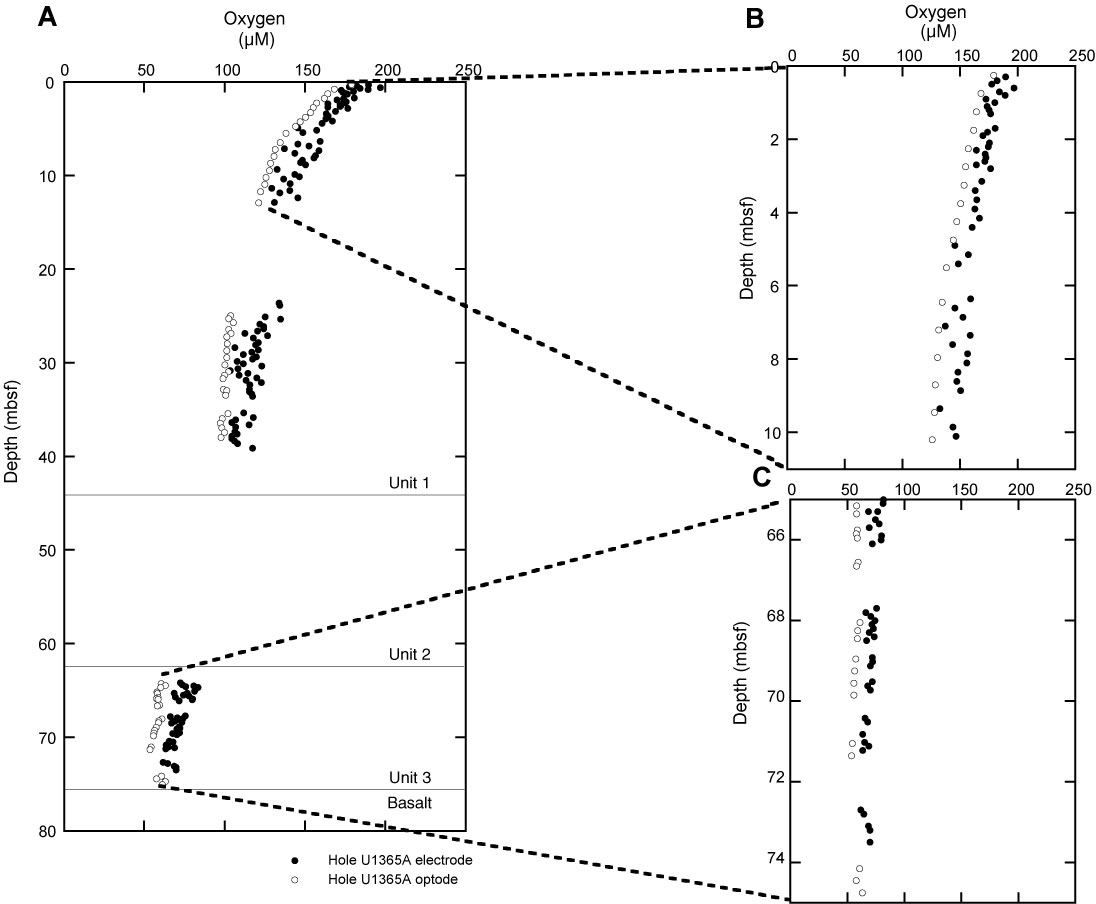
Figure F57. A. Plot of combined electrode and optode measurements of dissolved oxygen from Hole U1365A. Data attributed to drilling and handling effects have been removed for clarity. B. Plot of Hole U1365A optode and electrode determinations of dissolved oxygen in the uppermost 10 m of sediment. C. Plot of Hole U1365A optode and electrode determinations of dissolved oxygen in the Unit III (below chert) sediments.

Previous | Close | Next | Top of page