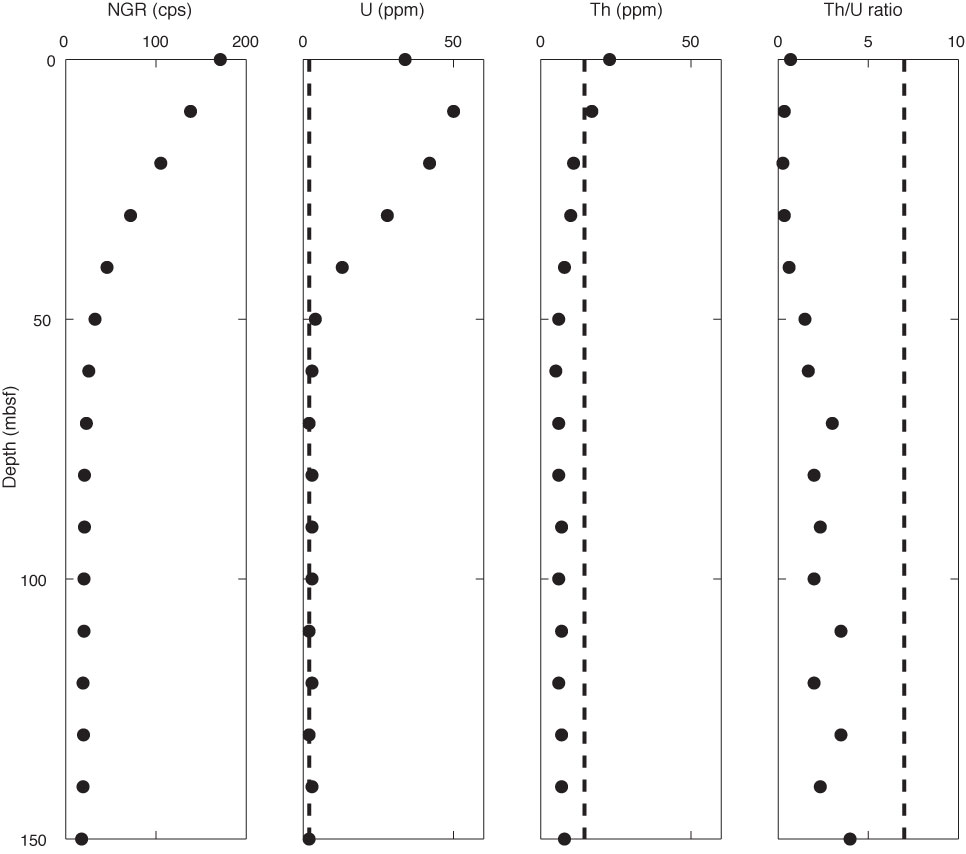
Figure F17. Plots of natural gamma radiation (NGR) analyses of the uppermost section of Hole U1366E. Circles show measurements on section as a function of depth, dashed lines show nodule concentrations of uranium, thorium, and their ratio in their respective panels.
Previous | Close | Next | Top of page