Previous | Close | Next
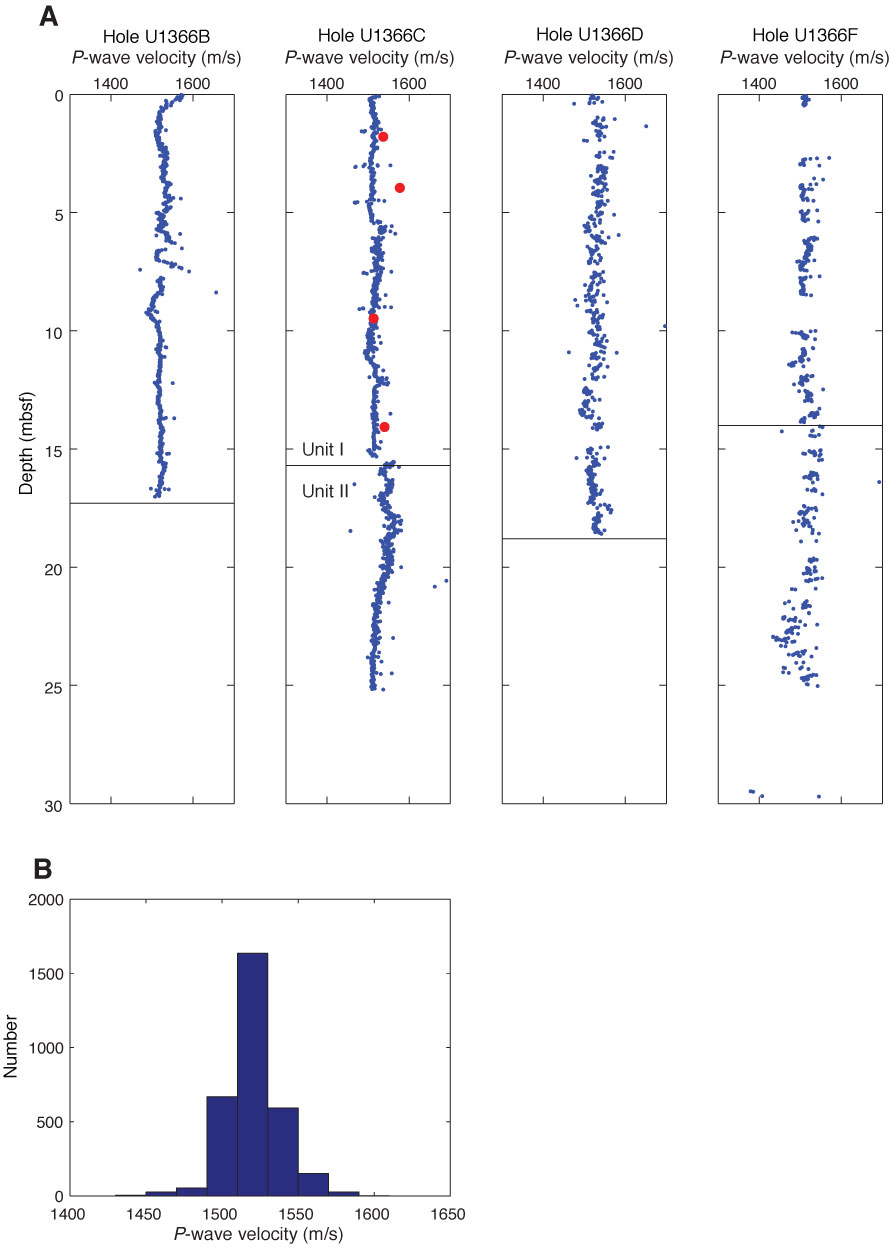
Figure F18. A. Plots of compressional wave velocity measured on the WRMSL for Holes U1366B–U1366D and U1366F. Red = discrete measurements along x-axis. B. Histogram of P-wave velocity from all holes.
Previous | Close | Next | Top of page