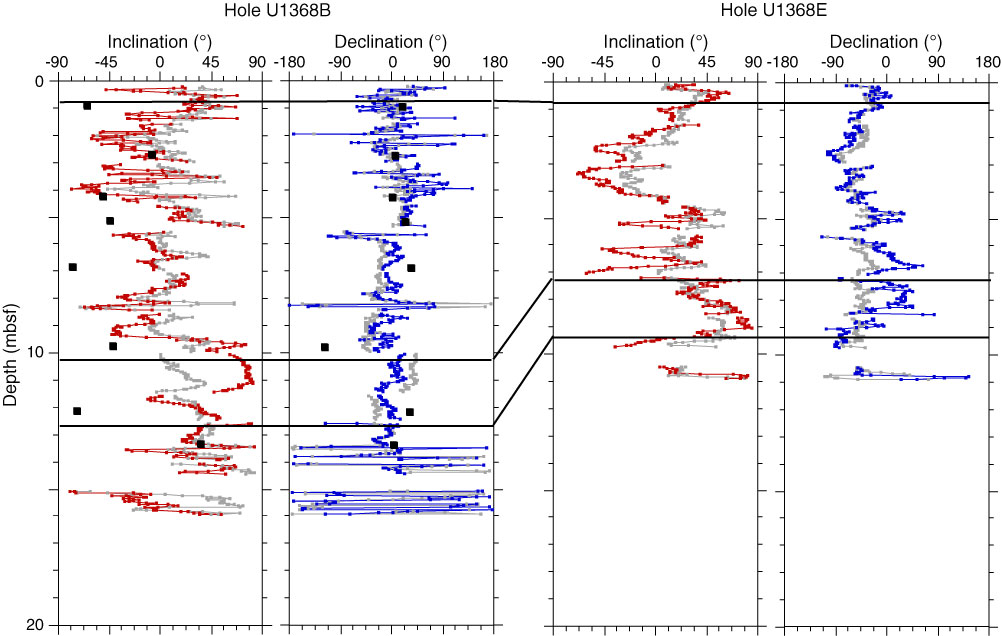
Figure F60. Correlation of polarity records between Holes U1368B and U1368E. Inclination (red) and declination (blue) data are after the 20 mT AF demagnetization step. Black lines indicate correlation points between holes. Gray = measurement before demagnetization. Black squares = magnetic directions of discrete cube samples from the working-half cores.
Previous | Close | Next | Top of page