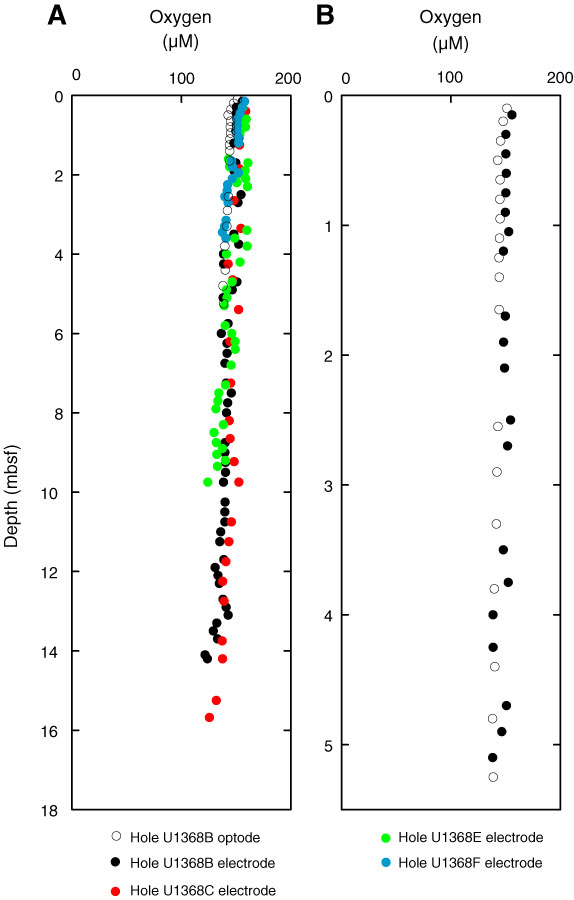
Figure F61. A. Plot of combined dissolved oxygen concentrations measured with optodes (Hole U1368B) and electrodes (Holes U1368B, U1368C, U1368E and U1368F). B. Combined dissolved oxygen concentrations in the uppermost 5.5 m of sediment, Hole U1368B.
Previous | Close | Next | Top of page