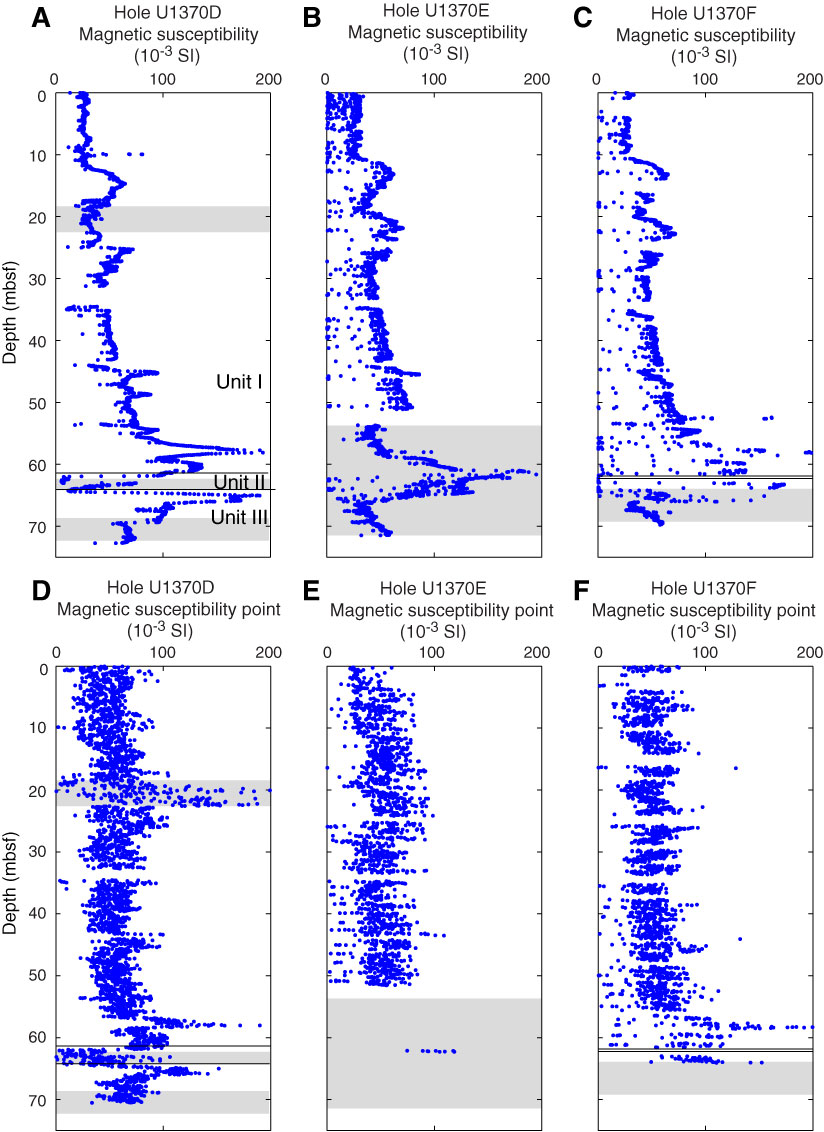
Figure F16. Plots of (A–C) magnetic susceptibility measurements made on the Whole-Core Multisensor Logger and (D–F) point magnetic susceptibility measurements made on the Section Half Multisensor Logger. Shaded regions denote areas of disturbed core.
Previous | Close | Next | Top of page