Previous | Close | Next
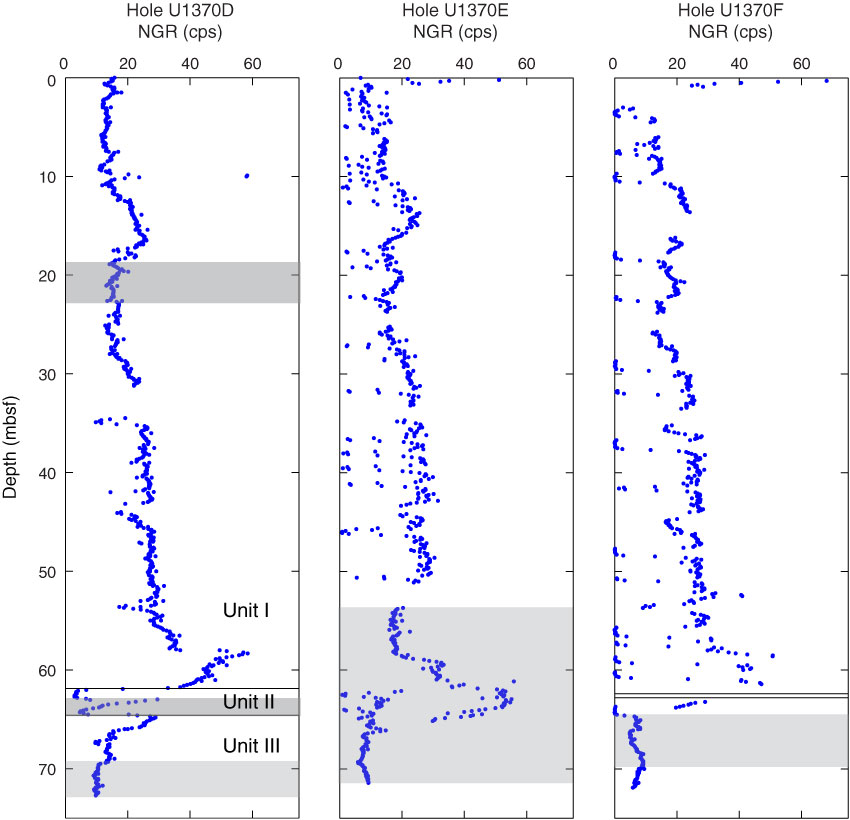
Figure F17. Plots of natural gamma radiation (NGR) as a function of depth, Site U1370. Shaded regions denote areas of disturbed core.
Previous | Close | Next | Top of page