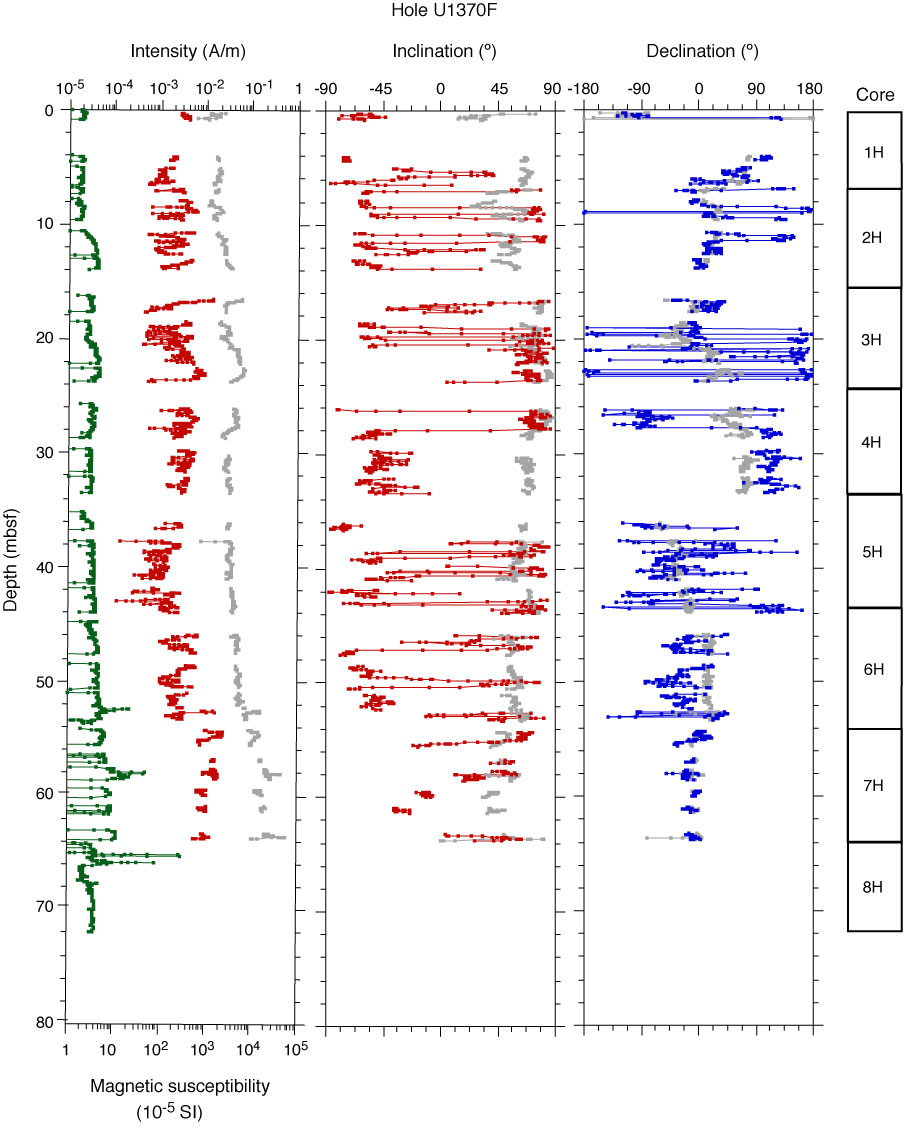
Figure F27. Summary of magnetic susceptibility and paleomagnetic results, Hole U1370F. Gray = measurements before demagnetization, red = data after 20 mT AF demagnetization step (inclination and intensity), blue = declination data, green = magnetic susceptibility data.
Previous | Close | Next | Top of page