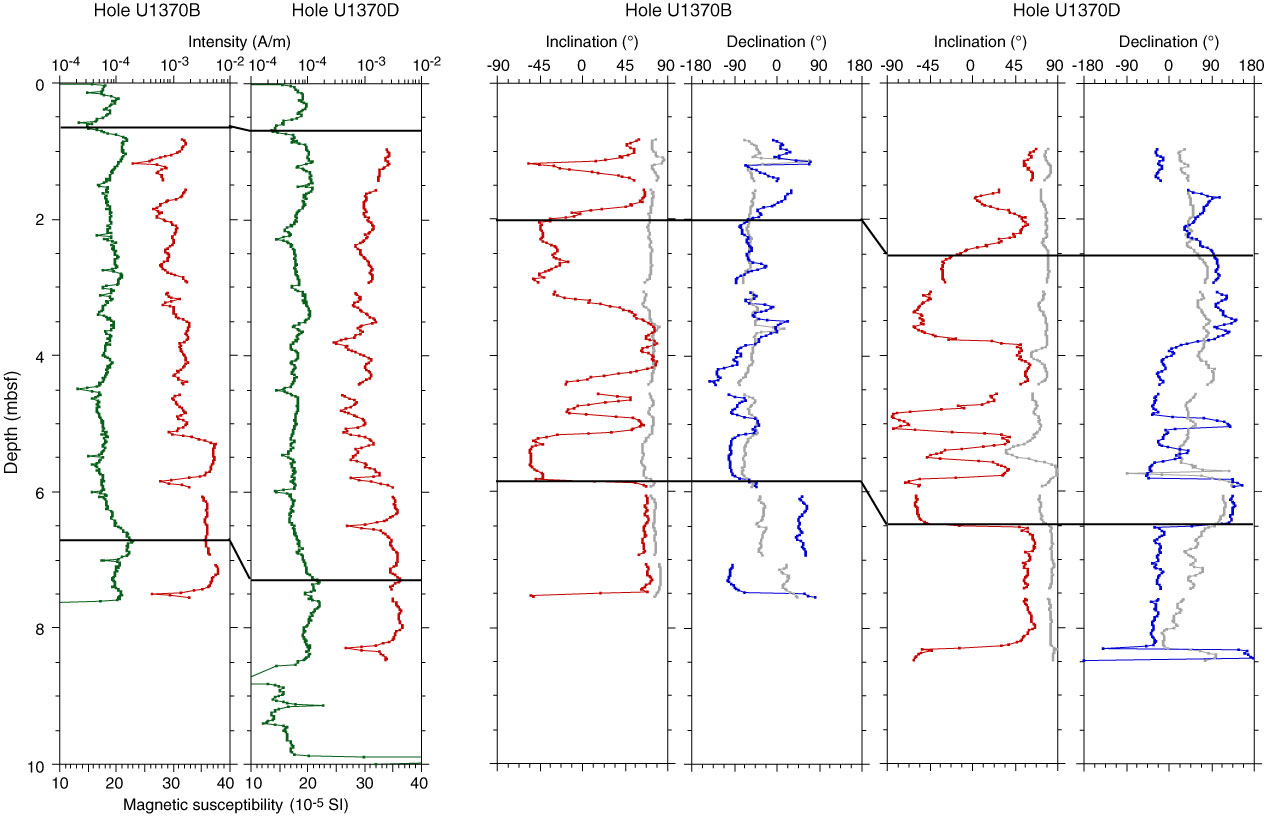
Figure F28. Results of hole-to-hole correlation using magnetic susceptibility (green) and magnetic intensity (red) data from Holes U1370B and U1370D. Black lines indicate correlation points between holes. Paleomagnetic data are also shown after application of the correlation. Gray = measurement before demagnetization, red = inclination after 20 mT AF demagnetization step, blue = declination after 20 mT demagnetization. Declinations are raw data before orientation using the Flexit tool.
Previous | Close | Next | Top of page