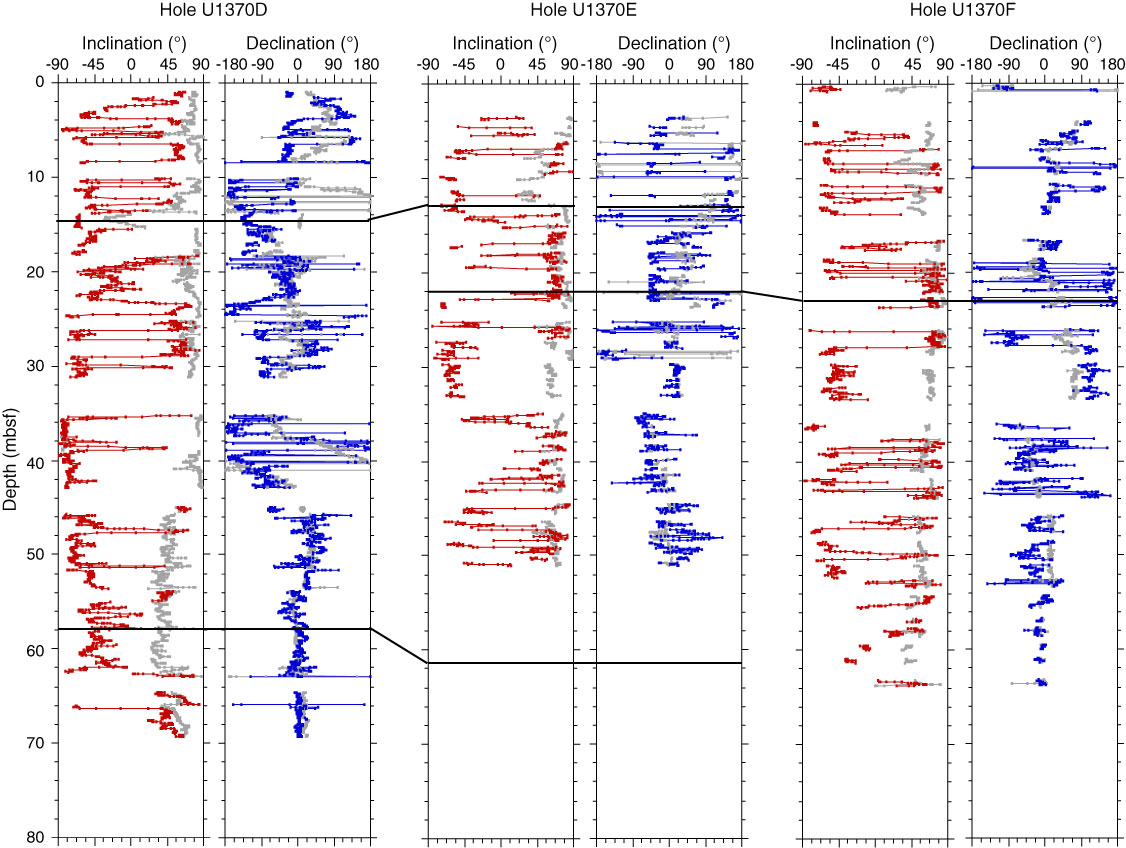
Figure F30. Correlation of the polarity records between Holes U1370D–U1370F. Inclination (red) and declination (blue) data are after the 20 mT AF demagnetization step. Black lines indicate correlation points between holes. Gray = measurements before demagnetization. Declinations are raw data before orientation using the Flexit tool.
Previous | Close | Next | Top of page