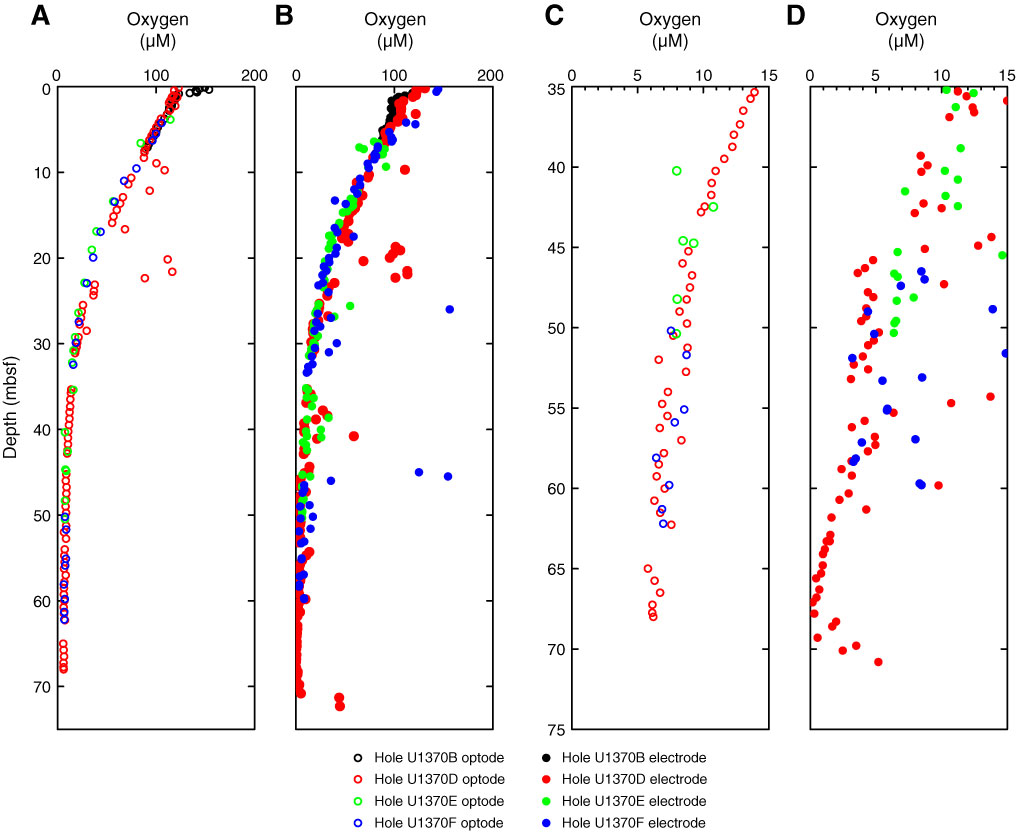
Figure F31. Plots of dissolved oxygen concentrations, Site U1370. A. Optode measurements. B. Electrode measurements. C. Optode measurements in the lowermost 35 m of sediment. D. Electrodes measurements in the lowermost 35 m of sediment.
Previous | Close | Next | Top of page