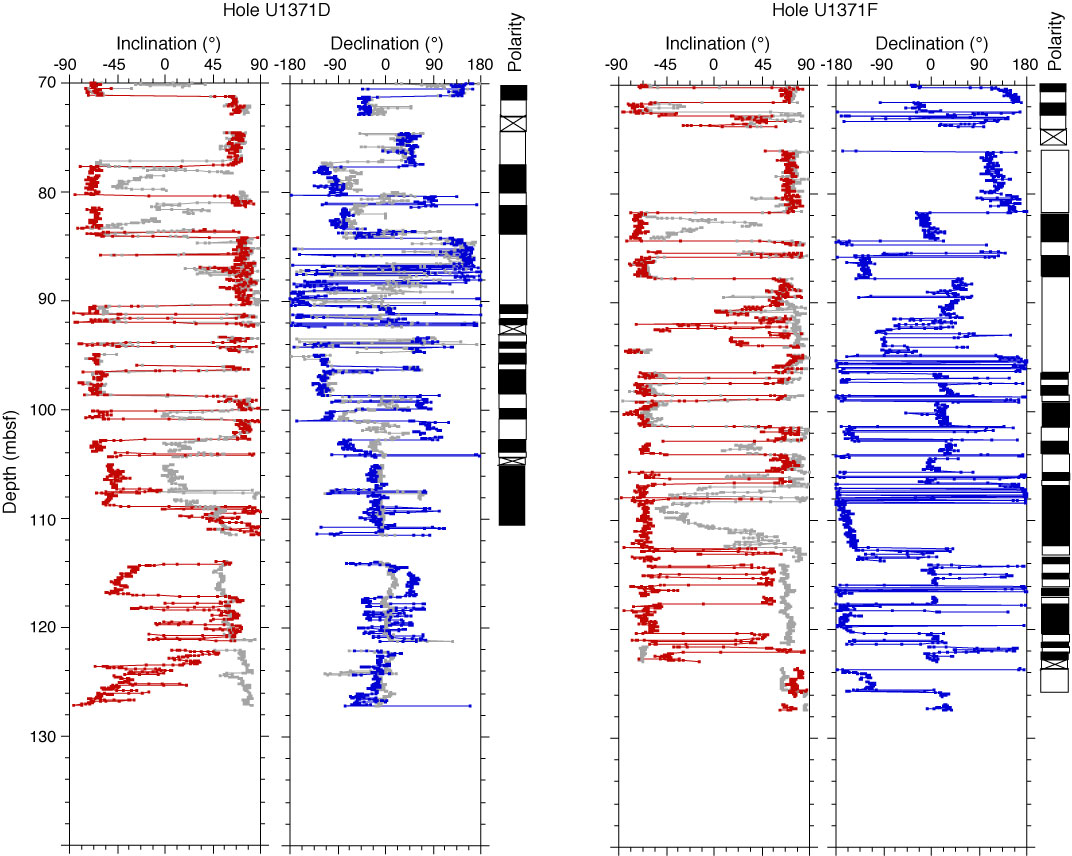
Figure F31. Comparison of polarity records between Holes U1371D and U1371F, 70–130 mbsf. Inclination (red) and declination (blue) data are after the 20 mT AF demagnetization step. Gray = measurement before demagnetization. Black indicates normal polarity, white reverse polarity.
Previous | Close | Next | Top of page