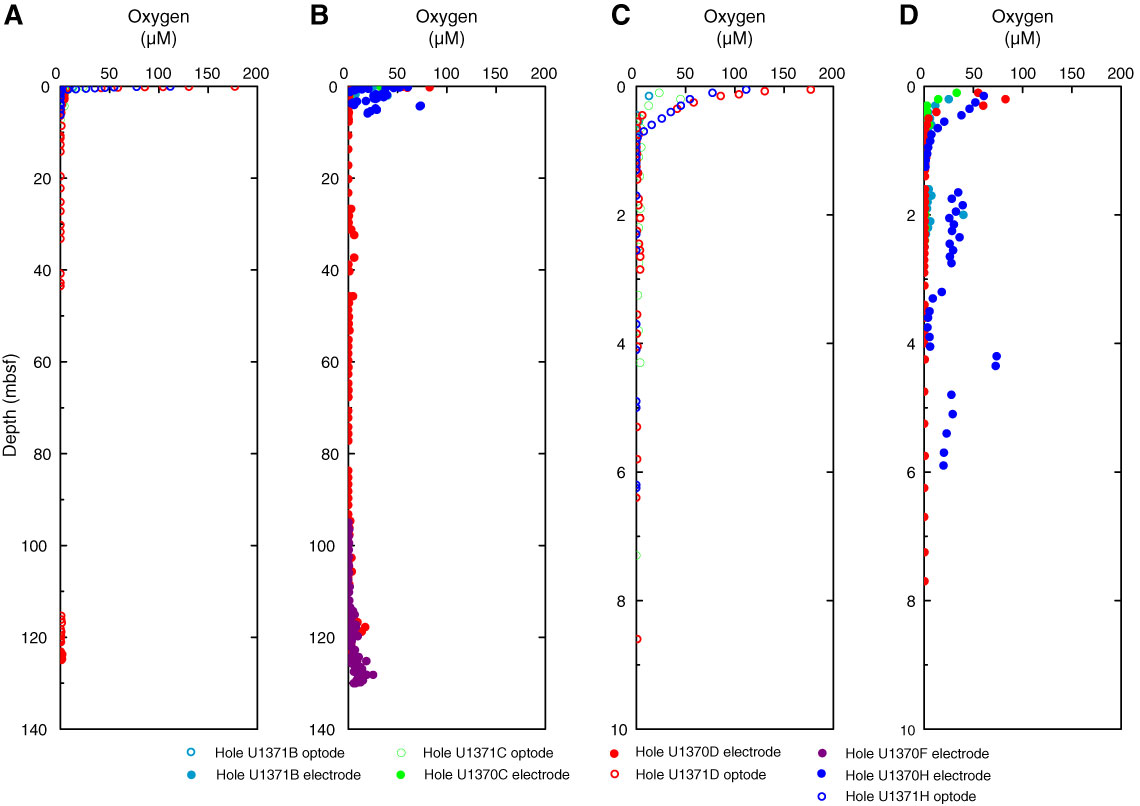
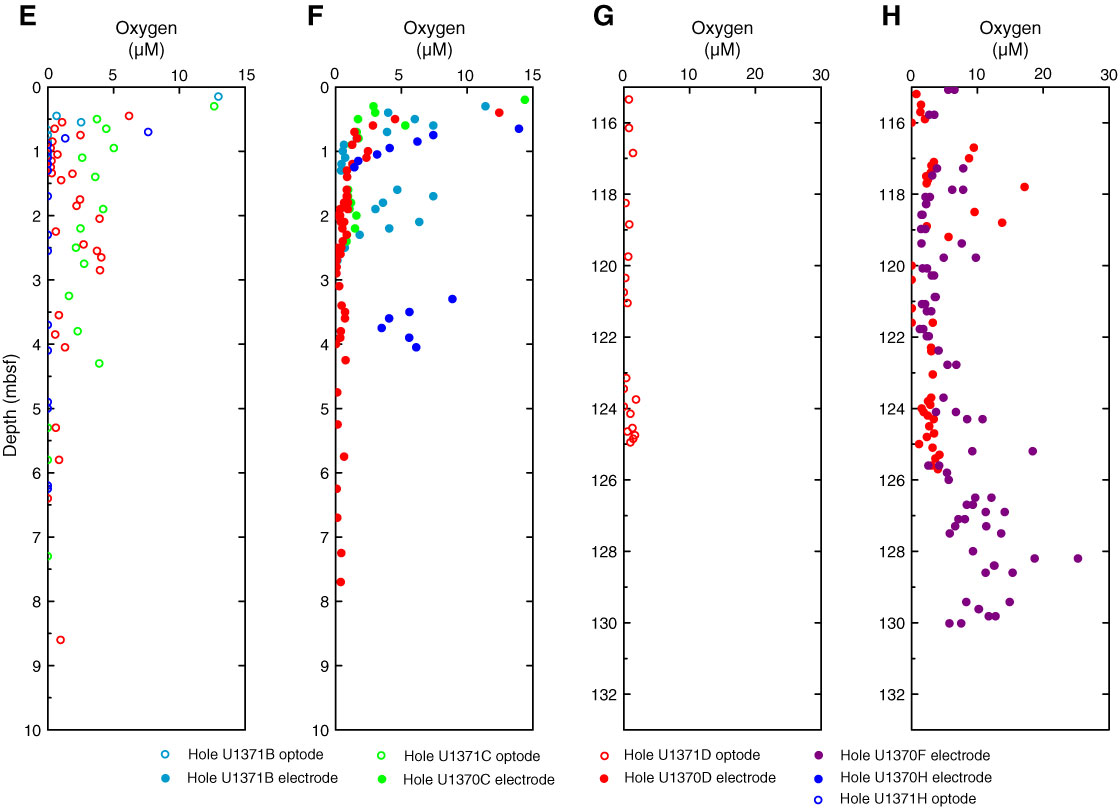
Figure F32. Plots of dissolved oxygen concentration, Site U1371. A. Optode measurements. B. Electrode measurements. C. Optode measurements in the uppermost 10 m of sediment. D. Electrode measurements in the uppermost 10 m of sediment. E. Optode measurements in uppermost 10 m of sediment with an expanded O2 scale. F. Electrode measurements in uppermost 10 m of sediment with an expanded O2 scale. G. Optode measurements in lowermost 115–135 mbsf of sediment with an expanded O2 scale. H. Electrode measurements in lowermost 115–135 mbsf of sediment with an expanded O2 scale.
Previous | Close | Next | Top of page