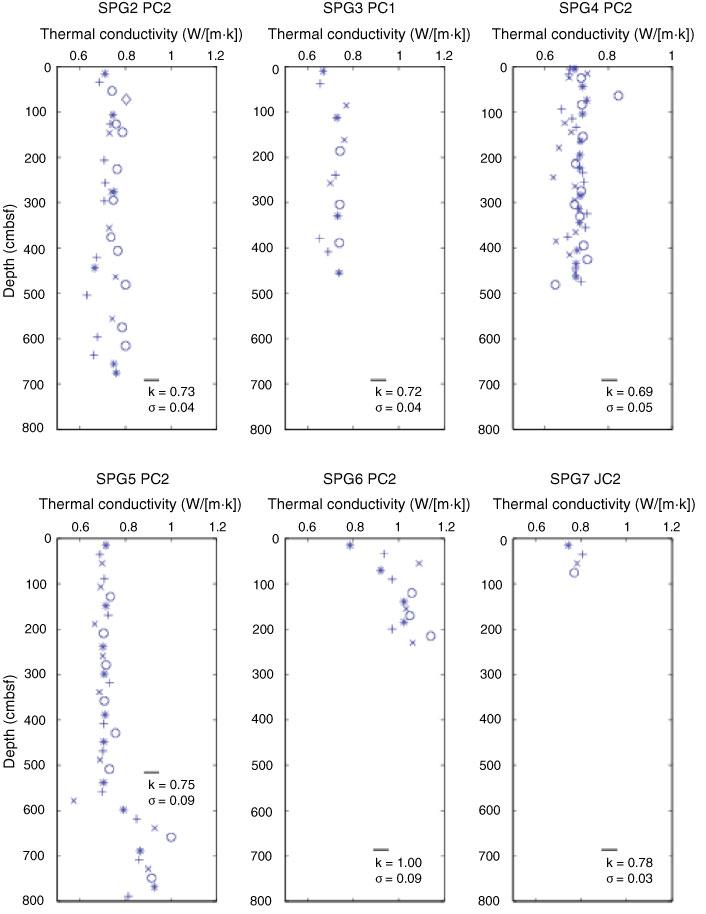
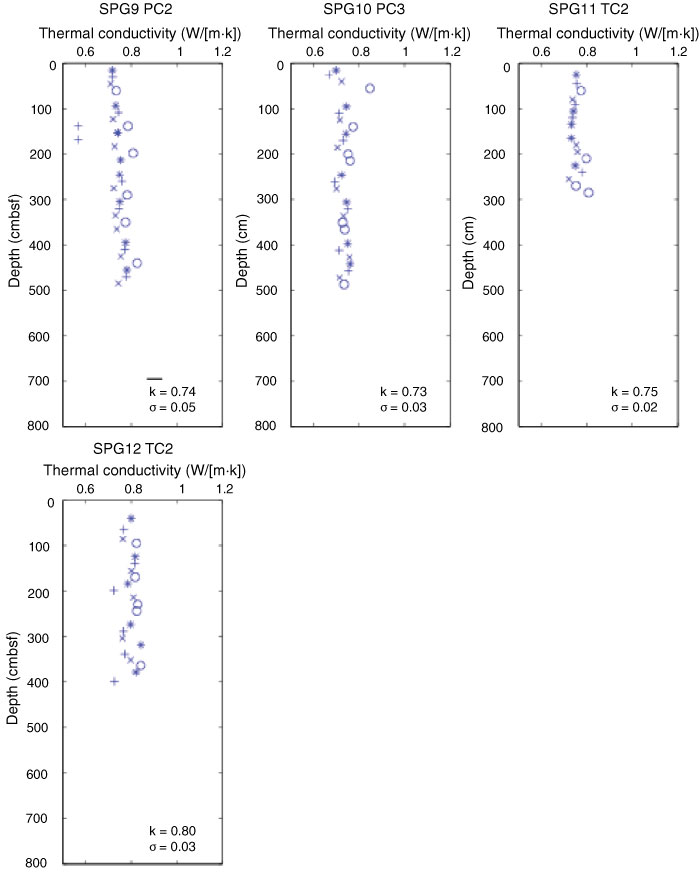
Figure F12. Plots of thermal conductivity values from coring sites. Thermal conductivities were determined with the needle-probe method. Different symbols correspond to different needle probes. k-bar = average thermal conductivity, σ = standard deviation.
Previous | Close | Next | Top of page