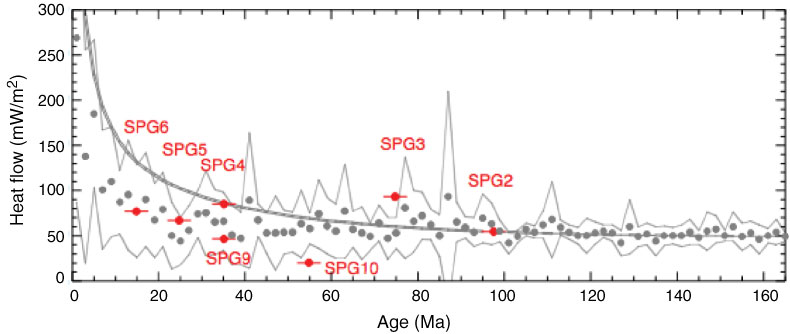
Figure F13. Plot of global marine heat flow compilation of Stein and Stein (1992). Gray circles = heat flow in 2 m.y. bins with standard deviation. Gray line shows best fit model based on global heat flow and bathymetry. Red circles = heat flow values collected at coring sites.
Previous | Close | Next | Top of page