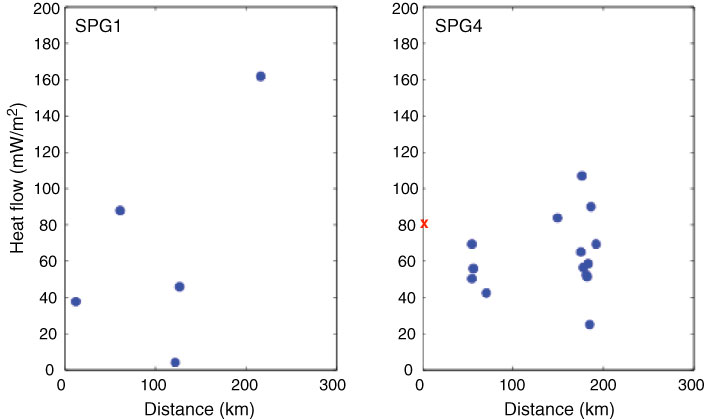
Figure F14. Plots of existing heat flow determinations in the vicinity of Sites SPG1 and SPG4. At both sites, values show variability, which suggests advective fluid flow in the basement. Red “x” indicates observed heat flow at Site SPG4.
Previous | Close | Next | Top of page