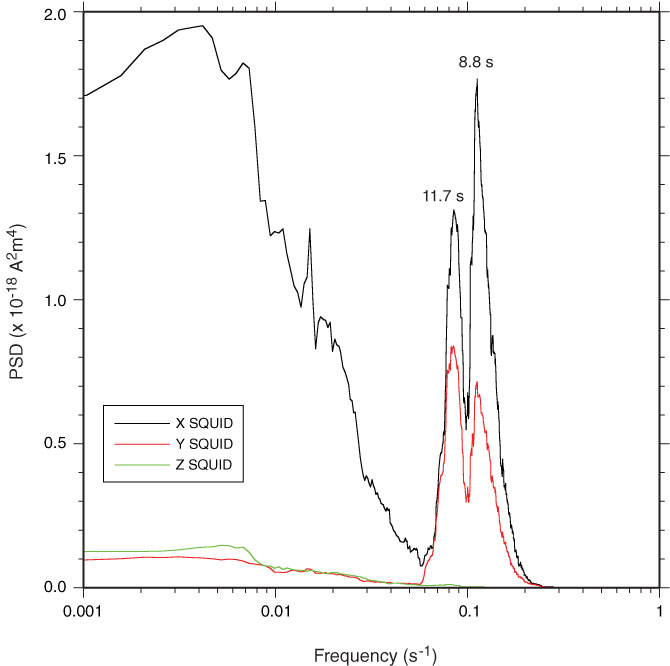
Figure F13. Power spectra for magnetic moments from the three axes of the superconducting quantum interference device (SQUID) cryogenic magnetometer. Note the prominent peaks near the dominant period of wave motion. Data were recorded at a ~2 Hz sampling rate on a relatively calm day on station. PSD = power spectral density.
Previous | Close | Next | Top of page