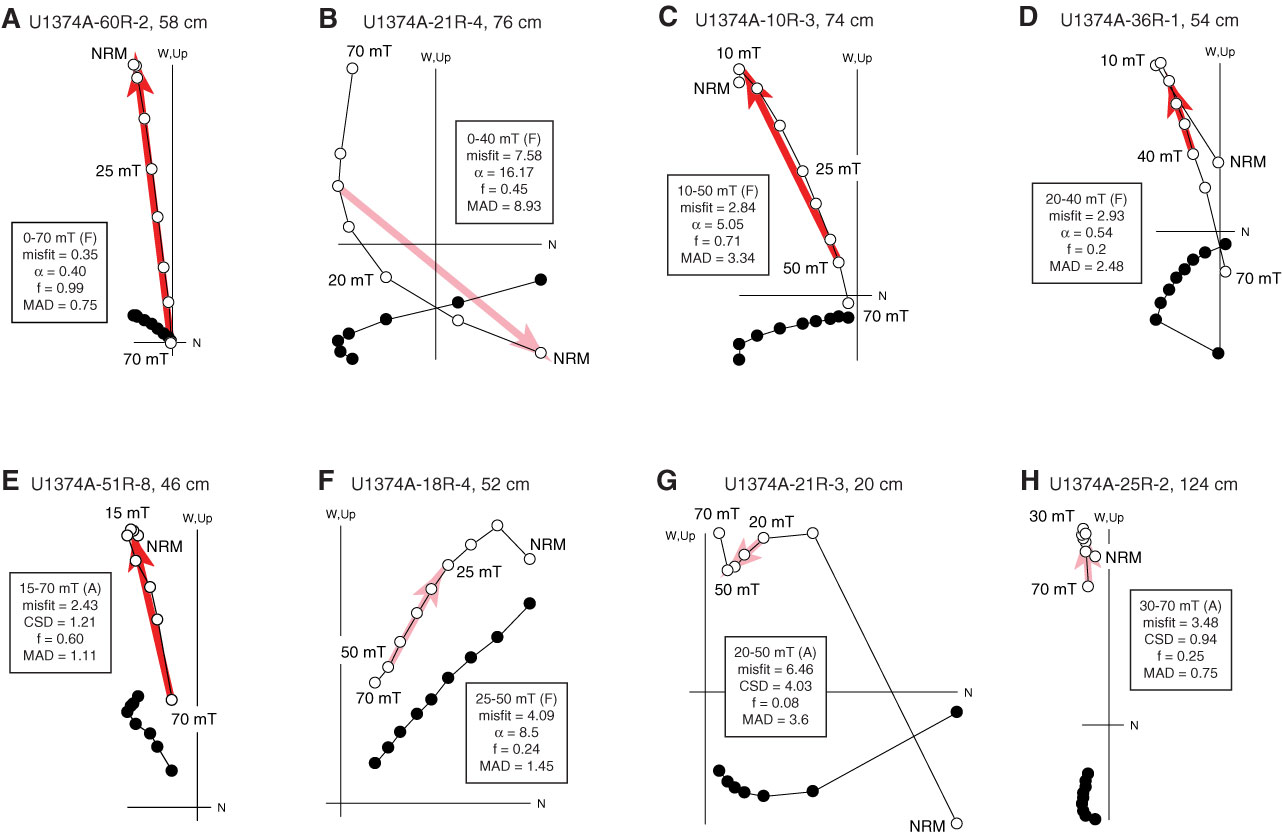
Figure F14. A–H. Zijderveld diagrams of representative archive-half core demagnetization data illustrating results of automated PCA technique. Open circles = projections of remanent magnetization onto vertical plane, solid circles = projections of remanent magnetization onto horizontal plane. Dark red arrows = PCA directions with misfits < 3.4, lighter red arrows = directions associated with misfits > 3.4. Inset box gives treatment range for PCA fit (A = anchored to origin, F = free of origin) and resulting misfit parameters. MAD = maximum angular deviation (°), CSD = circular standard deviation, f = remanence, α = solid angle between unconstrained PCA fit and anchored to origin fit (°). See “Paleomagnetism” for discussion of misfit parameters.

Previous | Close | Next | Top of page