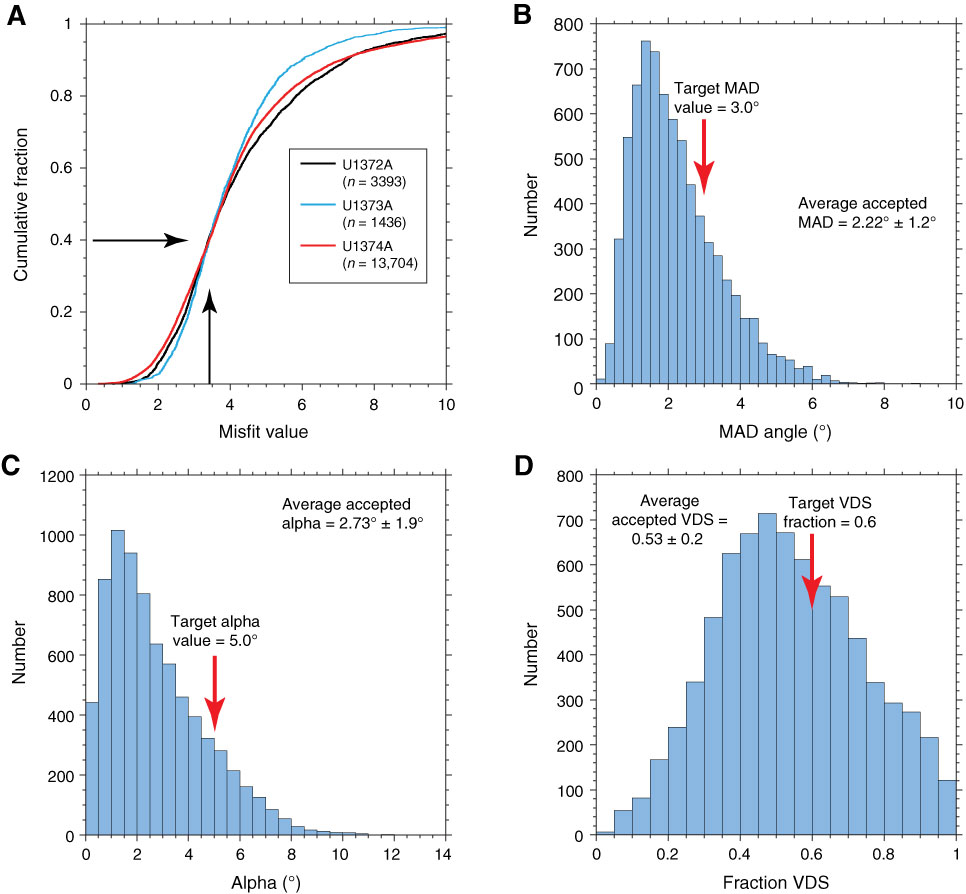
Figure F15. Summary statistics for automated PCA picks from archive-half core data. A. Distribution of misfit levels for data from Holes U1372A, U1373A, and U1374A. Note that all three cumulative distribution functions cross at a misfit value of ~3.4. B–D. Distribution of maximum angular deviation (MAD), deviation from origin (alpha), and percentage of vector difference sum (VDS) remanence. Their averages for the 40% of PCAs with misfit values < 3.4 are also presented.
Previous | Close | Next | Top of page