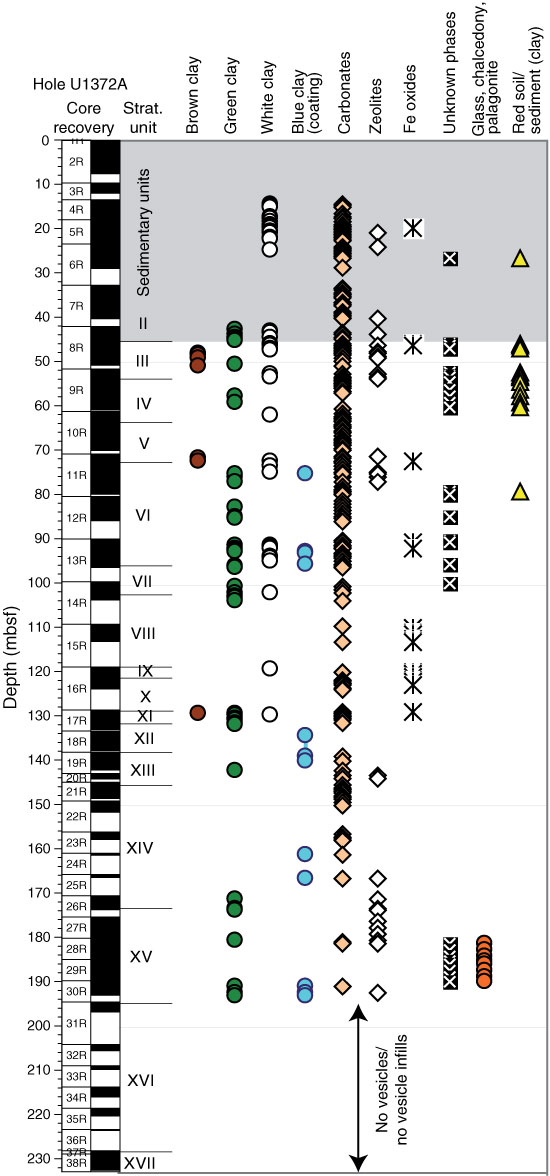
Figure F36. Plot of downhole distribution of secondary minerals infilling vesicles for each interval defined by the alteration petrology group. Symbols are located at center depth for each interval. Note that carbonates predominate above 90 mbsf but decrease in abundance at greater depths. Gray shading represents sedimentary units.
Previous | Close | Next | Top of page