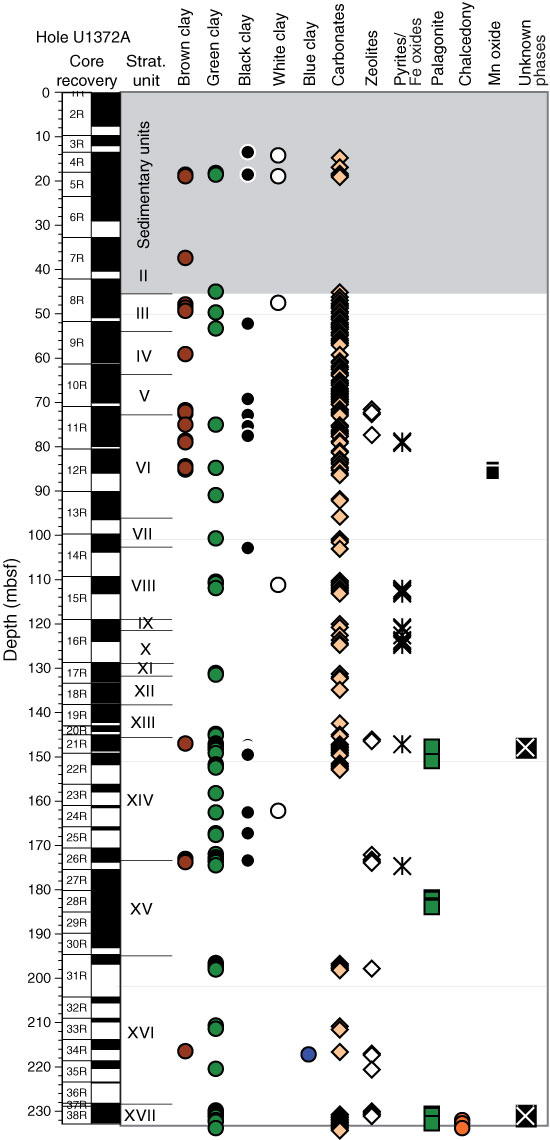
Figure F37. Plot of downhole distribution of vein minerals for each interval defined by the alteration petrology group. Symbols are located at center depth for each interval. Note the predominance of carbonates from 40 to 90 mbsf, followed by the decrease in abundance at greater depths. Gray shading represents sedimentary units.
Previous | Close | Next | Top of page