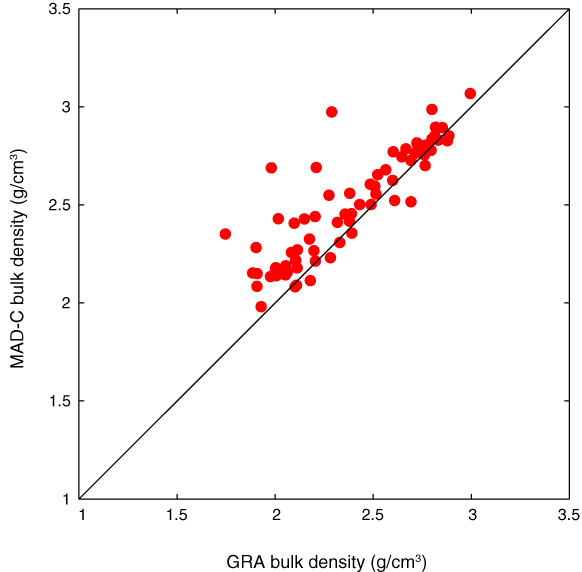
Figure F58. Plot of whole-round gamma ray attenuation (GRA) bulk density vs. moisture and density Method C (MAD-C) bulk density from discrete samples, Hole U1372A. Results show a nearly one-to-one linear relationship, with values from GRA bulk density often slightly lower than those from discrete samples (see text for explanation).
Previous | Close | Next | Top of page