Previous | Close | Next
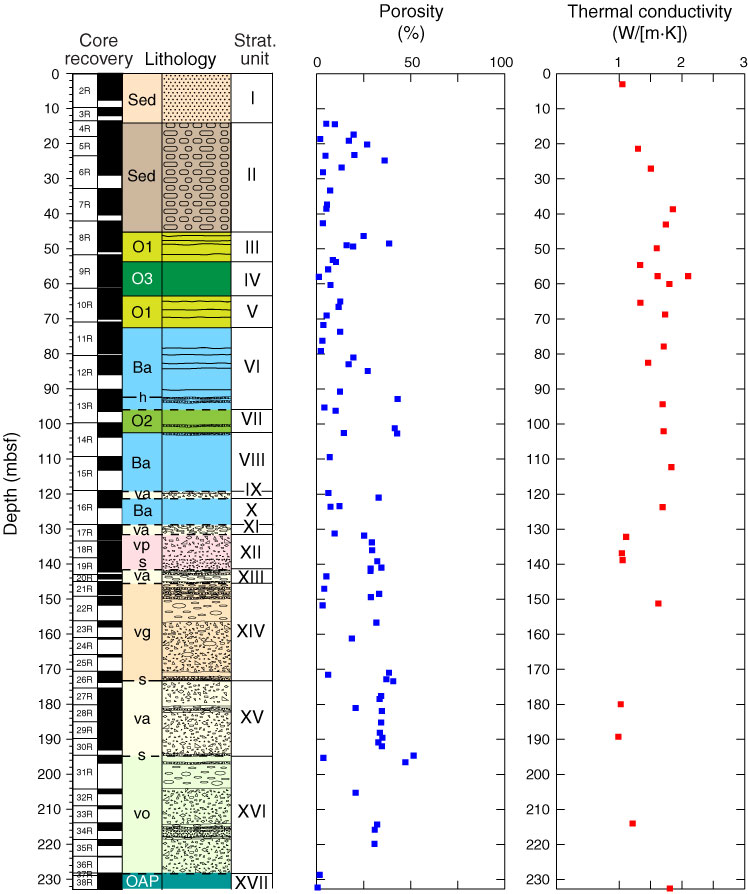
Figure F59. Depth profiles of MAD-C porosity and thermal conductivity from discrete samples, Hole U1372A, shown in relation to stratigraphic column. For explanation of stratigraphy, see Figure F18.
Previous | Close | Next | Top of page