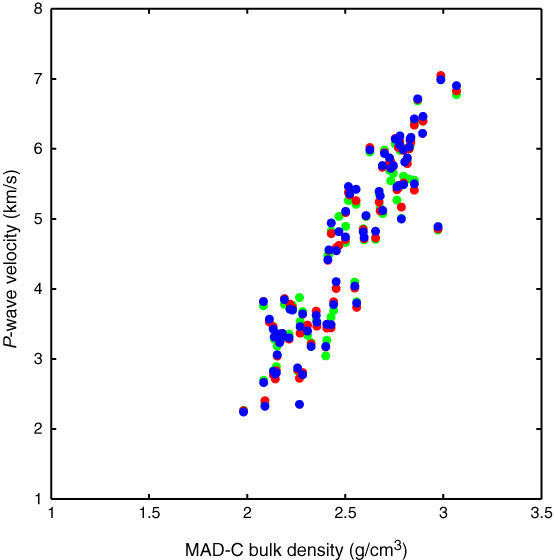
Figure F60. Plot of moisture and density Method C (MAD-C) bulk density values from discrete samples vs. discrete P-wave velocity, Hole U1372A, showing an approximately linear relationship. Colors represent different orientations for discrete P-wave velocity measurements: blue = x-axis (normal to split-core surface), red = y-axis (parallel to split-core surface), green = z-axis (downcore).
Previous | Close | Next | Top of page